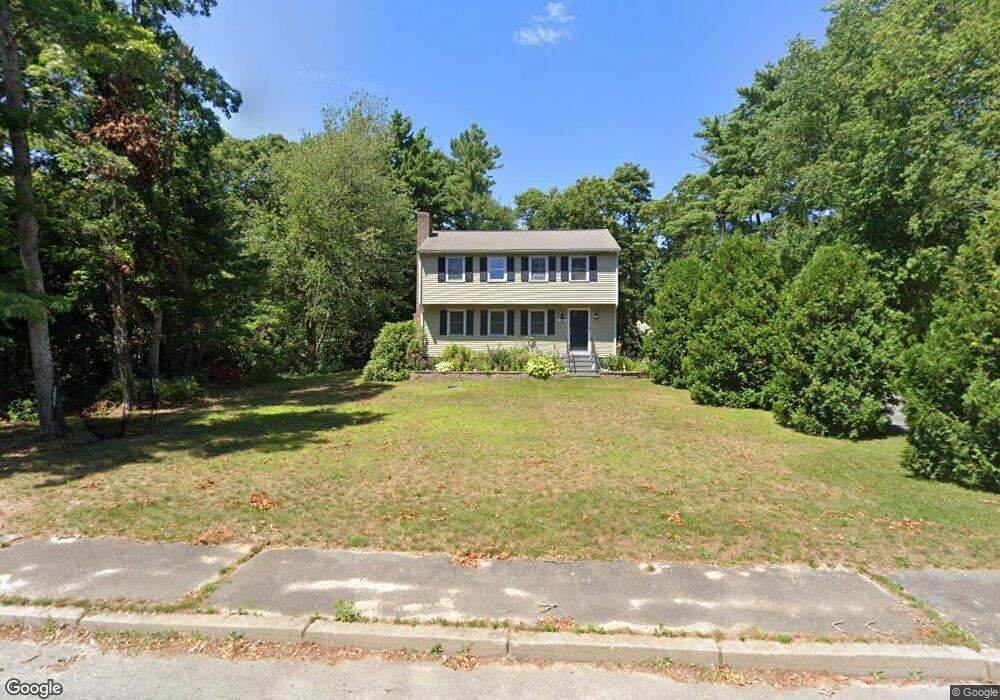
21 Dinahs Way Wareham, MA 02571
Estimated Value: $532,801 - $630,000
4
Beds
2
Baths
1,600
Sq Ft
$365/Sq Ft
Est. Value
About This Home
This home is located at 21 Dinahs Way, Wareham, MA 02571 and is currently estimated at $584,700, approximately $365 per square foot. 21 Dinahs Way is a home located in Plymouth County with nearby schools including Tabor Academy.
Ownership History
Date
Name
Owned For
Owner Type
Purchase Details
Closed on
Jul 7, 2011
Sold by
Anderson Erica L
Bought by
Anderson Erica L and Anderson Stephen P
Current Estimated Value
Home Financials for this Owner
Home Financials are based on the most recent Mortgage that was taken out on this home.
Original Mortgage
$223,783
Outstanding Balance
$154,029
Interest Rate
4.75%
Mortgage Type
FHA
Estimated Equity
$430,671
Purchase Details
Closed on
Jun 17, 2011
Sold by
7 Hills Community Svc
Bought by
Anderson Erica L
Home Financials for this Owner
Home Financials are based on the most recent Mortgage that was taken out on this home.
Original Mortgage
$223,783
Outstanding Balance
$154,029
Interest Rate
4.75%
Mortgage Type
FHA
Estimated Equity
$430,671
Create a Home Valuation Report for This Property
The Home Valuation Report is an in-depth analysis detailing your home's value as well as a comparison with similar homes in the area
Purchase History
| Date | Buyer | Sale Price | Title Company |
|---|---|---|---|
| Anderson Erica L | -- | -- | |
| Anderson Erica L | -- | -- | |
| Anderson Erica L | -- | -- | |
| Anderson Erica L | $231,900 | -- | |
| Anderson Erica L | $231,900 | -- | |
| Anderson Erica L | $231,900 | -- |
Source: Public Records
Mortgage History
| Date | Status | Borrower | Loan Amount |
|---|---|---|---|
| Open | Anderson Erica L | $223,783 | |
| Closed | Anderson Erica L | $223,783 | |
| Previous Owner | Anderson Erica L | $40,000 |
Source: Public Records
Tax History
| Year | Tax Paid | Tax Assessment Tax Assessment Total Assessment is a certain percentage of the fair market value that is determined by local assessors to be the total taxable value of land and additions on the property. | Land | Improvement |
|---|---|---|---|---|
| 2025 | $4,423 | $424,500 | $137,300 | $287,200 |
| 2024 | $4,411 | $392,800 | $109,900 | $282,900 |
| 2023 | $3,962 | $349,500 | $100,300 | $249,200 |
| 2022 | $3,962 | $300,600 | $100,300 | $200,300 |
| 2021 | $4,179 | $290,500 | $100,300 | $190,200 |
| 2020 | $3,673 | $277,000 | $100,300 | $176,700 |
| 2019 | $4,090 | $268,900 | $103,400 | $165,500 |
| 2018 | $4,021 | $252,500 | $103,400 | $149,100 |
| 2017 | $3,263 | $242,600 | $103,400 | $139,200 |
| 2016 | $2,959 | $218,700 | $99,200 | $119,500 |
| 2015 | $2,858 | $218,700 | $99,200 | $119,500 |
| 2014 | $3,119 | $242,700 | $108,300 | $134,400 |
Source: Public Records
Map
Nearby Homes
- 6 Bourne Terrace
- 10 Longmeadow Dr
- 233 Marion Rd
- 7 Maud Palmer Dr
- 1 Emma Ln Unit B
- 437 Main St
- 15 14th Ave
- 19 Station St
- 17 Station St
- 9 Woodville Way
- 110 Mayflower Ridge Dr
- 4 Mather Dr
- 2645 Cranberry Hwy Unit A
- 189 Pine View Terrace
- 15 Broadmarsh Ave
- 12 Oakdale St
- 6 Allen Ave
- 20 Grant St
- 6 Wildwood Ave
- 43 Shore Ave
Your Personal Tour Guide
Ask me questions while you tour the home.