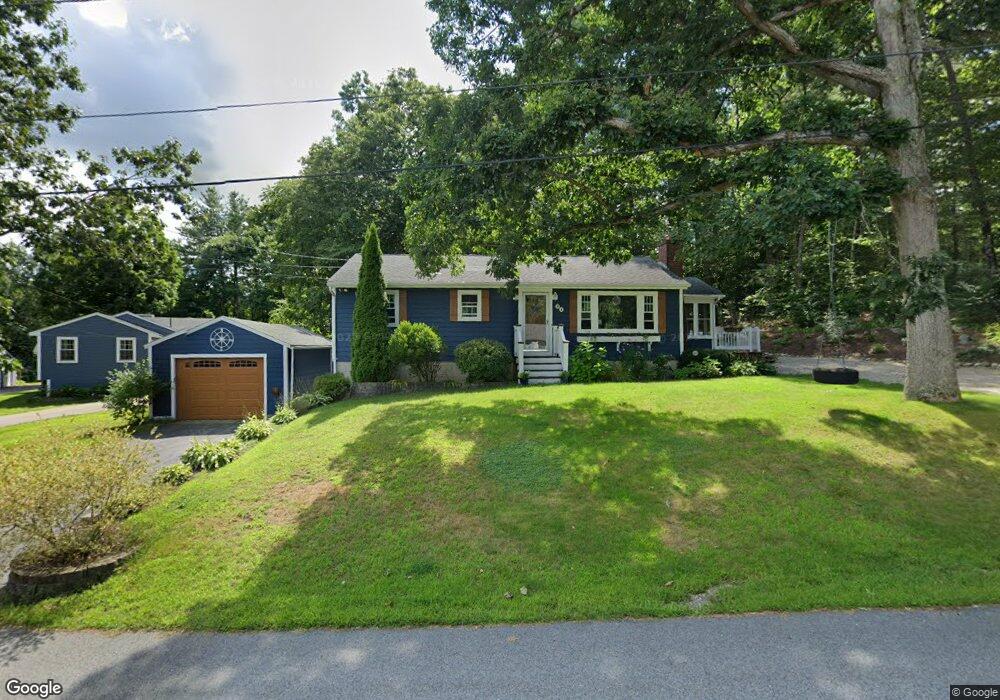
21 Dixon Ave Newfields, NH 03856
Estimated Value: $420,642 - $572,000
3
Beds
1
Bath
1,304
Sq Ft
$382/Sq Ft
Est. Value
About This Home
This home is located at 21 Dixon Ave, Newfields, NH 03856 and is currently estimated at $497,661, approximately $381 per square foot. 21 Dixon Ave is a home located in Rockingham County with nearby schools including Newfields Elementary School, Cooperative Middle School, and Exeter High School.
Ownership History
Date
Name
Owned For
Owner Type
Purchase Details
Closed on
Mar 19, 2025
Sold by
Smith Robert F and Smith Kyle C
Bought by
Kyle Csmith Ret and Smith
Current Estimated Value
Purchase Details
Closed on
Dec 1, 1998
Sold by
Macdonald Timothy S and Macdonald Patricia A
Bought by
Smith Robert F and Smith Kyle C
Home Financials for this Owner
Home Financials are based on the most recent Mortgage that was taken out on this home.
Original Mortgage
$125,450
Interest Rate
6.83%
Create a Home Valuation Report for This Property
The Home Valuation Report is an in-depth analysis detailing your home's value as well as a comparison with similar homes in the area
Home Values in the Area
Average Home Value in this Area
Purchase History
| Date | Buyer | Sale Price | Title Company |
|---|---|---|---|
| Kyle Csmith Ret | -- | None Available | |
| Kyle Csmith Ret | -- | None Available | |
| Smith Robert F | $127,000 | -- | |
| Smith Robert F | $127,000 | -- |
Source: Public Records
Mortgage History
| Date | Status | Borrower | Loan Amount |
|---|---|---|---|
| Previous Owner | Smith Robert F | $144,615 | |
| Previous Owner | Smith Robert F | $125,450 |
Source: Public Records
Tax History
| Year | Tax Paid | Tax Assessment Tax Assessment Total Assessment is a certain percentage of the fair market value that is determined by local assessors to be the total taxable value of land and additions on the property. | Land | Improvement |
|---|---|---|---|---|
| 2025 | $6,351 | $374,700 | $188,400 | $186,300 |
| 2024 | $6,029 | $374,700 | $188,400 | $186,300 |
| 2023 | $5,917 | $374,700 | $188,400 | $186,300 |
| 2022 | $5,473 | $261,100 | $133,000 | $128,100 |
| 2021 | $5,366 | $261,100 | $133,000 | $128,100 |
| 2020 | $5,546 | $261,100 | $133,000 | $128,100 |
| 2019 | $5,376 | $261,100 | $133,000 | $128,100 |
| 2018 | $5,183 | $261,100 | $133,000 | $128,100 |
| 2017 | $5,597 | $233,800 | $133,000 | $100,800 |
| 2016 | $5,429 | $233,800 | $133,000 | $100,800 |
| 2015 | $5,384 | $233,800 | $133,000 | $100,800 |
| 2014 | $5,670 | $233,800 | $133,000 | $100,800 |
| 2013 | $5,677 | $233,800 | $133,000 | $100,800 |
Source: Public Records
Map
Nearby Homes
- 28 Partridge Hill Rd
- 104 Piscassic Rd
- 100 Exeter Rd
- 3 Swamscott St
- 120 Exeter Rd
- 00 Piscassic & Oaklands Rd Unit 1
- 0 Autumn Ln
- 5 Ridge Rd
- 12 Runaway Rd
- 20 Madison Ln
- 85 College Rd
- 221 Piscassic Rd
- 10 Wingate Ct
- 1 Firefly Landing
- 74 College Rd
- 9 Captain's Way
- 5 Stone Ridge Ln
- 0 Pear Tree Ln Unit 9
- 0 Pear Tree Ln Unit 10
- 62 Green Rd
Your Personal Tour Guide
Ask me questions while you tour the home.