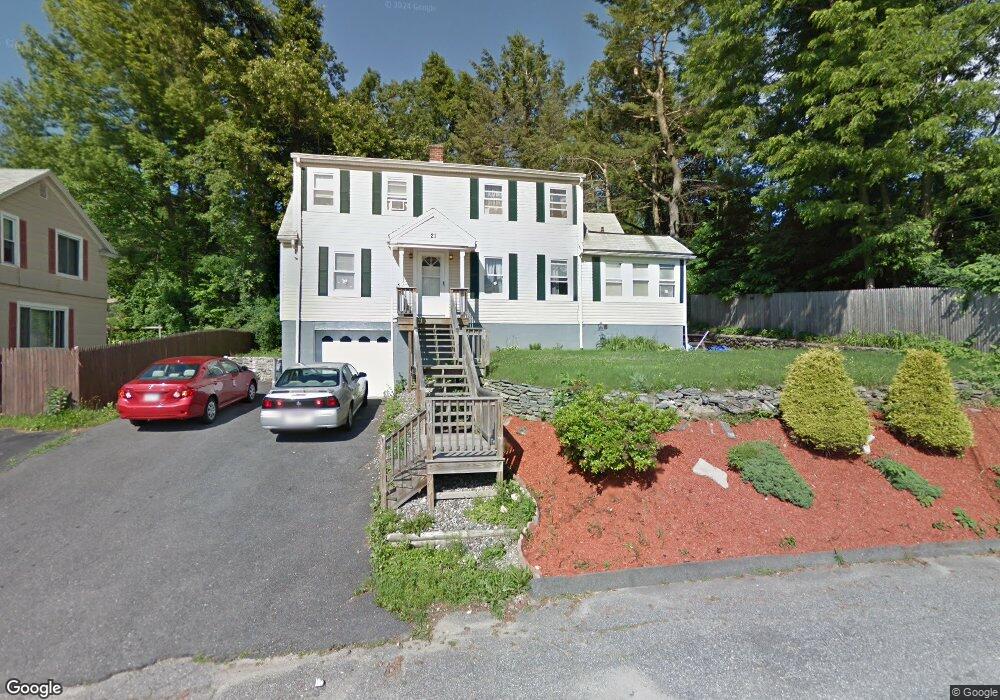
21 Doris St Worcester, MA 01606
Summit NeighborhoodEstimated Value: $522,000 - $646,000
5
Beds
2
Baths
2,312
Sq Ft
$243/Sq Ft
Est. Value
About This Home
This home is located at 21 Doris St, Worcester, MA 01606 and is currently estimated at $562,932, approximately $243 per square foot. 21 Doris St is a home located in Worcester County with nearby schools including Norrback Avenue Elementary School, Jacob Hiatt Magnet School, and Chandler Magnet.
Ownership History
Date
Name
Owned For
Owner Type
Purchase Details
Closed on
May 18, 2007
Sold by
Yodice Daniel B
Bought by
Elmi Omar
Current Estimated Value
Home Financials for this Owner
Home Financials are based on the most recent Mortgage that was taken out on this home.
Original Mortgage
$259,000
Outstanding Balance
$157,628
Interest Rate
6.18%
Mortgage Type
Purchase Money Mortgage
Estimated Equity
$405,304
Purchase Details
Closed on
Jun 27, 1990
Sold by
Kudron D J
Bought by
Yodice Daniel B
Home Financials for this Owner
Home Financials are based on the most recent Mortgage that was taken out on this home.
Original Mortgage
$138,700
Interest Rate
10.27%
Mortgage Type
Purchase Money Mortgage
Purchase Details
Closed on
Apr 28, 1988
Sold by
Landry Frances A
Bought by
Kudron D J
Home Financials for this Owner
Home Financials are based on the most recent Mortgage that was taken out on this home.
Original Mortgage
$103,900
Interest Rate
9.86%
Mortgage Type
Purchase Money Mortgage
Create a Home Valuation Report for This Property
The Home Valuation Report is an in-depth analysis detailing your home's value as well as a comparison with similar homes in the area
Home Values in the Area
Average Home Value in this Area
Purchase History
| Date | Buyer | Sale Price | Title Company |
|---|---|---|---|
| Elmi Omar | $259,000 | -- | |
| Yodice Daniel B | $146,000 | -- | |
| Kudron D J | $129,900 | -- |
Source: Public Records
Mortgage History
| Date | Status | Borrower | Loan Amount |
|---|---|---|---|
| Open | Elmi Omar | $259,000 | |
| Previous Owner | Kudron D J | $133,200 | |
| Previous Owner | Kudron D J | $138,700 | |
| Previous Owner | Kudron D J | $103,900 |
Source: Public Records
Tax History
| Year | Tax Paid | Tax Assessment Tax Assessment Total Assessment is a certain percentage of the fair market value that is determined by local assessors to be the total taxable value of land and additions on the property. | Land | Improvement |
|---|---|---|---|---|
| 2025 | $6,376 | $483,400 | $119,000 | $364,400 |
| 2024 | $6,115 | $444,700 | $119,000 | $325,700 |
| 2023 | $5,706 | $397,900 | $103,500 | $294,400 |
| 2022 | $5,486 | $360,700 | $82,800 | $277,900 |
| 2021 | $4,814 | $295,700 | $66,200 | $229,500 |
| 2020 | $4,515 | $265,600 | $66,200 | $199,400 |
| 2019 | $4,653 | $258,500 | $59,700 | $198,800 |
| 2018 | $4,552 | $240,700 | $59,700 | $181,000 |
| 2017 | $4,309 | $224,200 | $59,700 | $164,500 |
| 2016 | $4,231 | $205,300 | $44,500 | $160,800 |
| 2015 | $4,120 | $205,300 | $44,500 | $160,800 |
| 2014 | $4,012 | $205,300 | $44,500 | $160,800 |
Source: Public Records
Map
Nearby Homes
- 328 Brooks St
- 31 Danielles Way
- 26 Danielles Way
- 10 Malden St
- 216 W Mountain St
- 12 Pinecroft Ave
- 1110 W Boylston St Unit A
- 10 Beale St
- 12 Beale St
- 16 Beale St
- 186 Doyle Rd
- 47 Eustis St
- 55 Apthorp St
- 38 Juniper Ln
- 504 Prospect St
- 93 Blue Bell Rd
- 36 Sunrise Ave
- 33 Santoro Rd
- 12 Whispering Pine Cir Unit 12
- 53 Mount Ave
Your Personal Tour Guide
Ask me questions while you tour the home.