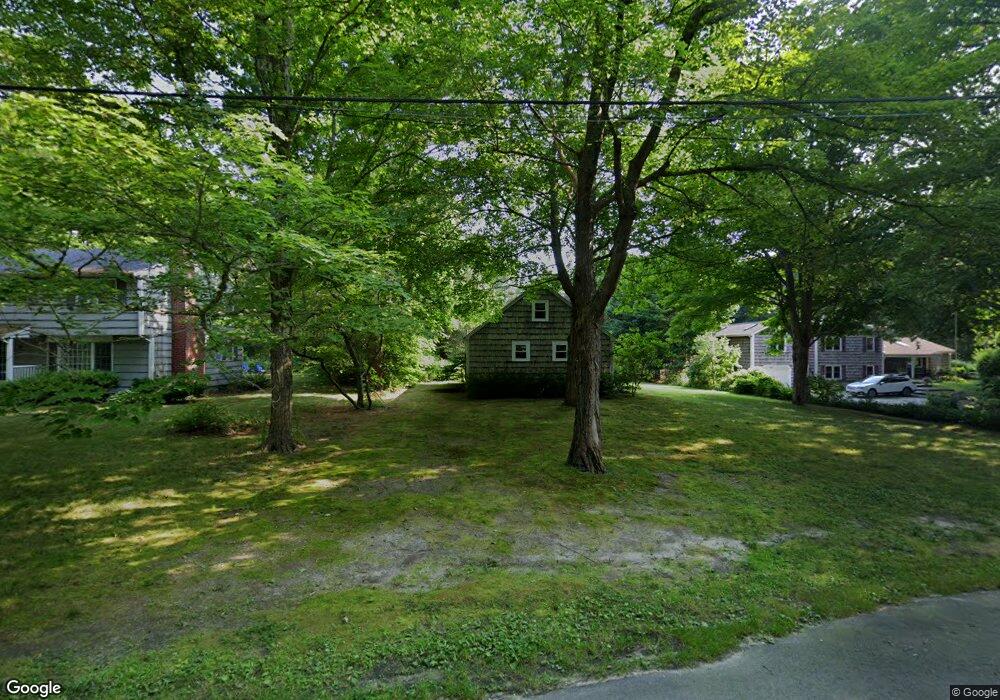
21 Douglas Ave Bourne, MA 2532
Monument Beach NeighborhoodEstimated Value: $559,000 - $699,000
2
Beds
1
Bath
2,000
Sq Ft
$302/Sq Ft
Est. Value
About This Home
This home is located at 21 Douglas Ave, Bourne, MA 2532 and is currently estimated at $603,282, approximately $301 per square foot. 21 Douglas Ave is a home located in Barnstable County with nearby schools including Bourne High School, St Margaret Regional School, and Cadence Academy Preschool - Bourne.
Ownership History
Date
Name
Owned For
Owner Type
Purchase Details
Closed on
May 27, 2004
Sold by
Johnson Scott W
Bought by
Piece Of Mind Lt and Johnson
Current Estimated Value
Purchase Details
Closed on
Jun 15, 2000
Sold by
Deforest Henry R and Johnson Judith W
Bought by
Johnson Scott W
Home Financials for this Owner
Home Financials are based on the most recent Mortgage that was taken out on this home.
Original Mortgage
$110,500
Interest Rate
8.24%
Mortgage Type
Purchase Money Mortgage
Create a Home Valuation Report for This Property
The Home Valuation Report is an in-depth analysis detailing your home's value as well as a comparison with similar homes in the area
Home Values in the Area
Average Home Value in this Area
Purchase History
| Date | Buyer | Sale Price | Title Company |
|---|---|---|---|
| Piece Of Mind Lt | -- | -- | |
| Piece Of Mind Lt | -- | -- | |
| Johnson Scott W | $130,000 | -- | |
| Johnson Scott W | $130,000 | -- |
Source: Public Records
Mortgage History
| Date | Status | Borrower | Loan Amount |
|---|---|---|---|
| Previous Owner | Johnson Scott W | $110,500 |
Source: Public Records
Tax History
| Year | Tax Paid | Tax Assessment Tax Assessment Total Assessment is a certain percentage of the fair market value that is determined by local assessors to be the total taxable value of land and additions on the property. | Land | Improvement |
|---|---|---|---|---|
| 2025 | $3,976 | $509,100 | $231,000 | $278,100 |
| 2024 | $3,888 | $484,800 | $220,000 | $264,800 |
| 2023 | $3,779 | $429,000 | $194,700 | $234,300 |
| 2022 | $3,614 | $358,200 | $172,300 | $185,900 |
| 2021 | $3,512 | $326,100 | $156,800 | $169,300 |
| 2020 | $3,327 | $309,800 | $155,300 | $154,500 |
| 2019 | $3,023 | $287,600 | $141,800 | $145,800 |
| 2018 | $2,888 | $274,000 | $135,100 | $138,900 |
| 2017 | $2,629 | $255,200 | $133,800 | $121,400 |
| 2016 | $2,569 | $252,900 | $133,800 | $119,100 |
| 2015 | $2,547 | $252,900 | $133,800 | $119,100 |
Source: Public Records
Map
Nearby Homes
- 566 Shore Rd
- 10 Howard Ave
- 10 Howard Ave
- 203 County Rd
- 14 Navajo Rd
- 20 Colony Ave
- 16 Amberwood Ct
- 5 Harbor Hill Dr
- 4 Harbor Hill Dr
- 709 County Rd
- 12 Turnberry Rd Unit 12
- 254 Barlows Landing Rd
- 13 Laurel Hill Ct
- 3 1st St
- 35 Benedict Rd
- 2 Applewood Ct
- 5 Sea Knoll Ct
- 16 Michael Rd
- 4 Hollyhock Knoll Ct Unit 4
- 4 Hollyhock Knoll Ct Unit 4
Your Personal Tour Guide
Ask me questions while you tour the home.