21 Drury Ct Berkeley, CA 94705
Claremont Hills NeighborhoodEstimated Value: $4,359,999 - $6,378,000
3
Beds
4
Baths
7,200
Sq Ft
$703/Sq Ft
Est. Value
About This Home
This home is located at 21 Drury Ct, Berkeley, CA 94705 and is currently estimated at $5,059,500, approximately $702 per square foot. 21 Drury Ct is a home located in Alameda County with nearby schools including Chabot Elementary School, Thornhill Elementary School, and Claremont Middle School.
Ownership History
Date
Name
Owned For
Owner Type
Purchase Details
Closed on
Sep 1, 2021
Sold by
Potter James G
Bought by
Potter James and Potter Beryl C
Current Estimated Value
Purchase Details
Closed on
Aug 10, 2005
Sold by
The Ronnie E Rogers Co
Bought by
Potter James G
Purchase Details
Closed on
Jul 12, 2005
Sold by
Rogers Ronnie and Borowiak Rogers Holly
Bought by
The Ronnie E Rogers Co
Create a Home Valuation Report for This Property
The Home Valuation Report is an in-depth analysis detailing your home's value as well as a comparison with similar homes in the area
Home Values in the Area
Average Home Value in this Area
Purchase History
| Date | Buyer | Sale Price | Title Company |
|---|---|---|---|
| Potter James | -- | None Available | |
| Potter James G | $3,750,000 | Chicago Title Co | |
| The Ronnie E Rogers Co | -- | -- |
Source: Public Records
Tax History
| Year | Tax Paid | Tax Assessment Tax Assessment Total Assessment is a certain percentage of the fair market value that is determined by local assessors to be the total taxable value of land and additions on the property. | Land | Improvement |
|---|---|---|---|---|
| 2025 | $51,101 | $3,979,646 | $399,689 | $3,586,957 |
| 2024 | $51,101 | $3,901,486 | $391,853 | $3,516,633 |
| 2023 | $54,358 | $3,831,873 | $384,172 | $3,447,701 |
| 2022 | $53,374 | $3,749,747 | $376,640 | $3,380,107 |
| 2021 | $51,996 | $3,676,109 | $369,257 | $3,313,852 |
| 2020 | $51,442 | $3,645,357 | $365,472 | $3,279,885 |
| 2019 | $50,118 | $3,573,907 | $358,309 | $3,215,598 |
| 2018 | $49,057 | $3,503,858 | $351,286 | $3,152,572 |
| 2017 | $47,411 | $3,435,181 | $344,401 | $3,090,780 |
| 2016 | $46,430 | $3,367,845 | $337,650 | $3,030,195 |
| 2015 | $46,218 | $3,317,284 | $332,581 | $2,984,703 |
| 2014 | $47,499 | $3,252,312 | $326,067 | $2,926,245 |
Source: Public Records
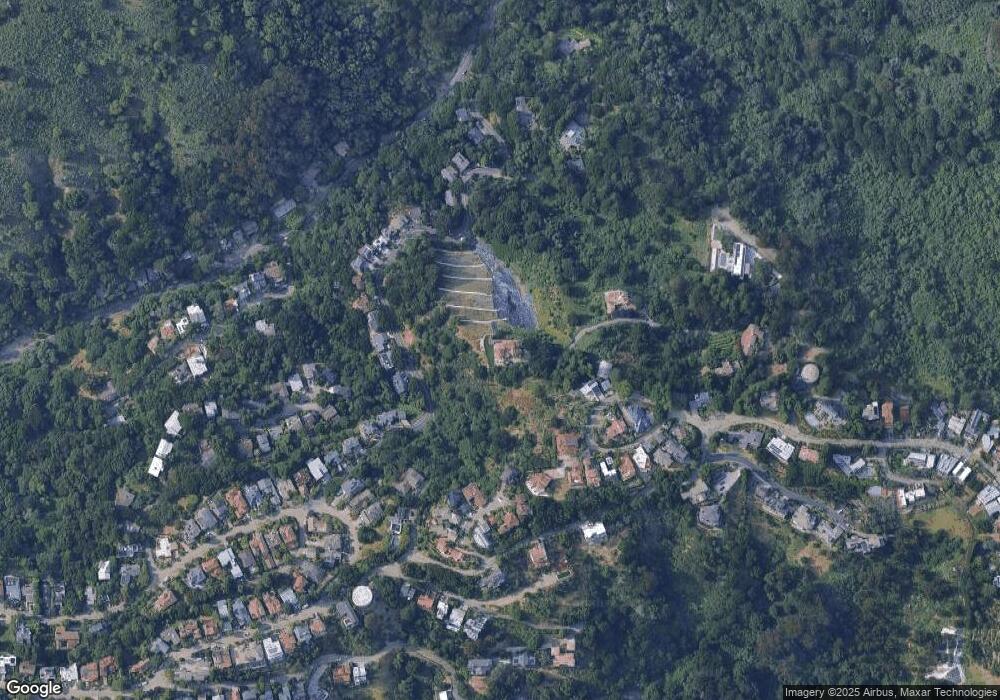
Map
Nearby Homes
- 1375 Alvarado Rd
- 1383 Alvarado Rd
- 0 Dartmouth Dr
- 0 Gypsy Ln
- 7723 Claremont Ave
- 1102 Grand View Dr
- 29 Live Oak Rd
- 7041 Devon Way
- 142 Gravatt Dr
- 7101 Marlborough Terrace
- 1426 Grand View Dr
- 150 Vicente Rd
- 2 Gravatt Dr
- 0 Gravatt Dr Unit 41122154
- 7003 Buckingham Blvd
- 0 Buckingham Blvd Unit 41115384
- 7137 Buckingham Blvd
- 7135 Buckingham Blvd
- 6971 Bristol Dr
- 6869 Bristol Dr
- 0 Drury Rd
- 29 Chancellor Place
- 37 Chancellor Place
- 11 Chancellor Place
- 1227 Alvarado Rd
- 39 Drury Ln
- 1239 Alvarado Rd
- 55 Chancellor Place
- 53 Chancellor Place
- 9 Chancellor Place
- 1145 Alvarado Rd
- 1247 Alvarado Rd
- 18 Chancellor Place
- 11 Drury Ct
- 1355 Alvarado Rd
- 25 Drury Ln
- 8 Chancellor Place
- 1127 Alvarado Rd
- 1293 Alvarado Rd
- 1098 Siler Place
Your Personal Tour Guide
Ask me questions while you tour the home.