Estimated Value: $158,207
--
Bed
--
Bath
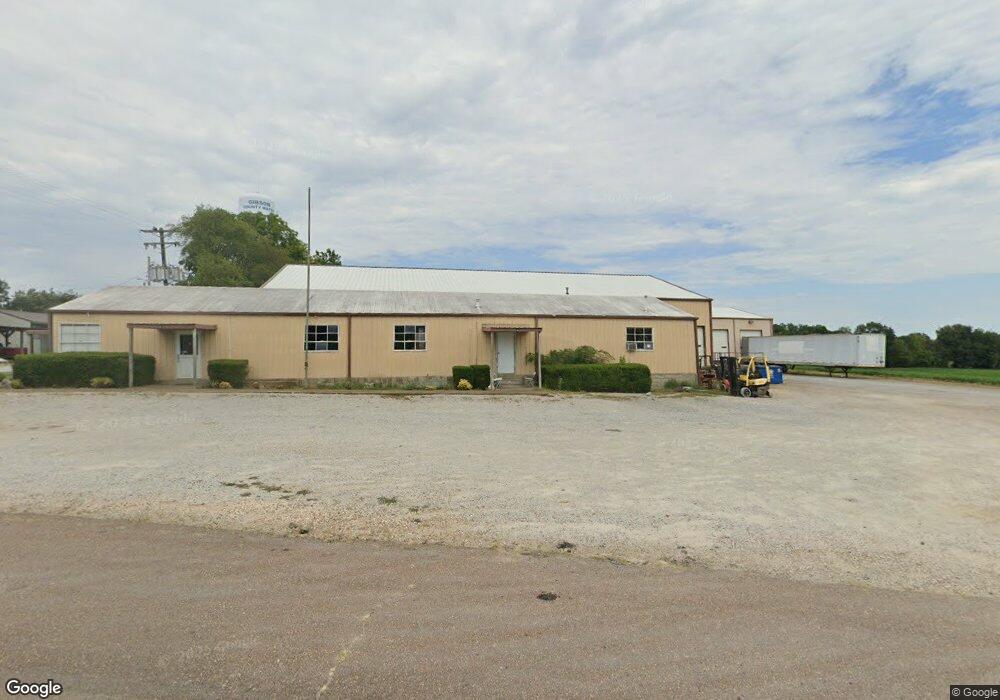
18,787
Sq Ft
$8/Sq Ft
Est. Value
About This Home
This home is located at 21 Dyer Hwy, Dyer, TN 38330 and is currently estimated at $158,207, approximately $8 per square foot. 21 Dyer Hwy is a home located in Gibson County with nearby schools including Yorkville Elementary School and Gibson County High School.
Ownership History
Date
Name
Owned For
Owner Type
Purchase Details
Closed on
Nov 28, 2016
Sold by
Galaxy Properties
Bought by
Seaton Kyle D and Dunagan James L
Current Estimated Value
Home Financials for this Owner
Home Financials are based on the most recent Mortgage that was taken out on this home.
Original Mortgage
$65,752
Outstanding Balance
$9,517
Interest Rate
3.47%
Mortgage Type
Commercial
Estimated Equity
$148,690
Purchase Details
Closed on
Nov 9, 2012
Sold by
Deese Co Llc
Bought by
Galaxy Properties
Purchase Details
Closed on
Mar 1, 2010
Sold by
First South Bank
Bought by
Deese Co
Home Financials for this Owner
Home Financials are based on the most recent Mortgage that was taken out on this home.
Original Mortgage
$130,000
Interest Rate
4.97%
Mortgage Type
Commercial
Purchase Details
Closed on
Apr 27, 2009
Sold by
Ben
Bought by
First South Bank
Purchase Details
Closed on
Oct 4, 1996
Sold by
Gibson County Plastics
Bought by
Gibson Co Plastics Inc
Purchase Details
Closed on
May 11, 1987
Bought by
Gibson County Plastics Inc
Purchase Details
Closed on
Jan 1, 1983
Purchase Details
Closed on
Jan 1, 1979
Purchase Details
Closed on
Jan 2, 1963
Create a Home Valuation Report for This Property
The Home Valuation Report is an in-depth analysis detailing your home's value as well as a comparison with similar homes in the area
Home Values in the Area
Average Home Value in this Area
Purchase History
| Date | Buyer | Sale Price | Title Company |
|---|---|---|---|
| Seaton Kyle D | $75,000 | -- | |
| Galaxy Properties | $125,300 | -- | |
| Deese Co | $130,000 | -- | |
| First South Bank | $140,000 | -- | |
| Gibson Co Plastics Inc | $4,150 | -- | |
| Gibson County Plastics Inc | -- | -- | |
| -- | $11,200 | -- | |
| -- | $22,000 | -- | |
| -- | -- | -- |
Source: Public Records
Mortgage History
| Date | Status | Borrower | Loan Amount |
|---|---|---|---|
| Open | Seaton Kyle D | $65,752 | |
| Previous Owner | Not Available | $130,000 |
Source: Public Records
Tax History Compared to Growth
Tax History
| Year | Tax Paid | Tax Assessment Tax Assessment Total Assessment is a certain percentage of the fair market value that is determined by local assessors to be the total taxable value of land and additions on the property. | Land | Improvement |
|---|---|---|---|---|
| 2024 | $2,249 | $89,200 | $6,000 | $83,200 |
| 2023 | $2,264 | $61,640 | $6,640 | $55,000 |
| 2022 | $2,221 | $61,640 | $6,640 | $55,000 |
| 2021 | $2,221 | $61,640 | $6,640 | $55,000 |
| 2020 | $1,875 | $61,640 | $6,640 | $55,000 |
| 2019 | $1,864 | $61,600 | $2,920 | $58,680 |
| 2018 | $1,824 | $48,520 | $2,920 | $45,600 |
| 2017 | $1,800 | $48,520 | $2,920 | $45,600 |
| 2016 | $1,800 | $48,520 | $2,920 | $45,600 |
| 2015 | $1,589 | $48,520 | $2,920 | $45,600 |
| 2014 | $1,649 | $50,360 | $2,920 | $47,440 |
Source: Public Records
Map
Nearby Homes
- 67 Ode Reed Rd
- 150 Dyer Hwy
- 0 Dyer Hwy
- 185 Loys Johnson Rd
- 61 Con Pennington Rd
- 1105 Old Dyersburg Rd
- lot Tatumville Rd
- 0 Old Dyersburg Rd
- 00 Old Dyersburg Rd
- 1149 Grills Rd
- 0 Shawnee Cobb Rd
- 215 Shawnee Cobb Rd
- 273 Fletcher Rd
- 271 Fletcher Rd
- 23 Gravettes Crossing Rd W
- 944 Mcknight St
- 1921 Forrester Rd
- 173 Orr Rd
- 288 W Broad St
- 109 Smith Ave