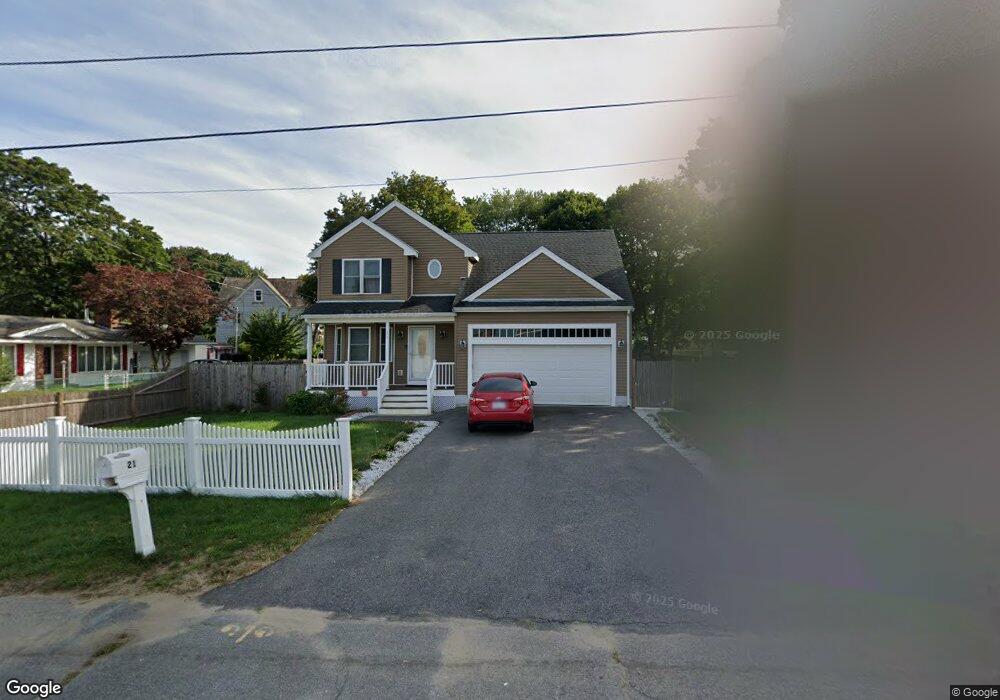
21 E Union St Brockton, MA 02302
Clifton Heights NeighborhoodEstimated Value: $615,146 - $744,000
4
Beds
4
Baths
2,038
Sq Ft
$323/Sq Ft
Est. Value
About This Home
This home is located at 21 E Union St, Brockton, MA 02302 and is currently estimated at $658,287, approximately $323 per square foot. 21 E Union St is a home with nearby schools including Gilmore Elementary School, Davis K-8 School, and John F. Kennedy Elementary School.
Ownership History
Date
Name
Owned For
Owner Type
Purchase Details
Closed on
Feb 5, 2016
Sold by
Phillip Rt
Bought by
Gitau Gilbert K and Karanja Mercy W
Current Estimated Value
Home Financials for this Owner
Home Financials are based on the most recent Mortgage that was taken out on this home.
Original Mortgage
$313,500
Outstanding Balance
$250,160
Interest Rate
3.98%
Mortgage Type
New Conventional
Estimated Equity
$408,127
Create a Home Valuation Report for This Property
The Home Valuation Report is an in-depth analysis detailing your home's value as well as a comparison with similar homes in the area
Home Values in the Area
Average Home Value in this Area
Purchase History
| Date | Buyer | Sale Price | Title Company |
|---|---|---|---|
| Gitau Gilbert K | $330,000 | -- |
Source: Public Records
Mortgage History
| Date | Status | Borrower | Loan Amount |
|---|---|---|---|
| Open | Gitau Gilbert K | $313,500 |
Source: Public Records
Tax History
| Year | Tax Paid | Tax Assessment Tax Assessment Total Assessment is a certain percentage of the fair market value that is determined by local assessors to be the total taxable value of land and additions on the property. | Land | Improvement |
|---|---|---|---|---|
| 2025 | $6,453 | $532,900 | $140,900 | $392,000 |
| 2024 | $6,030 | $501,700 | $140,900 | $360,800 |
| 2023 | $6,478 | $499,100 | $108,400 | $390,700 |
| 2022 | $5,701 | $408,100 | $98,600 | $309,500 |
| 2021 | $5,200 | $358,600 | $82,800 | $275,800 |
| 2020 | $5,548 | $366,200 | $76,700 | $289,500 |
| 2019 | $5,009 | $322,300 | $74,500 | $247,800 |
| 2018 | $5,069 | $315,600 | $74,500 | $241,100 |
| 2017 | $5,345 | $331,962 | $73,000 | $258,962 |
| 2016 | $1,259 | $72,500 | $72,500 | $0 |
| 2015 | $1,316 | $72,500 | $72,500 | $0 |
| 2014 | $1,314 | $72,500 | $72,500 | $0 |
Source: Public Records
Map
Nearby Homes
- 15 E Union St
- 4 Smith Ave
- 31 E Union St
- 31 E Union St Unit 2
- 15 Smith Ave
- 9 E Union St
- 19 Smith Ave
- Plot 12 E Union St
- 18 Smith Ave
- 14 Curve St
- 39 E Union St
- 23 Smith Ave
- 20 Curve St
- 24 Smith Ave
- 25 Smith Ave
- 49 E Union St
- 28 Smith Ave
- 16 Curve Ave
- 16 Curve Ave Unit 2nd Flr
- 16 Curve Ave Unit 1st Flr
Your Personal Tour Guide
Ask me questions while you tour the home.