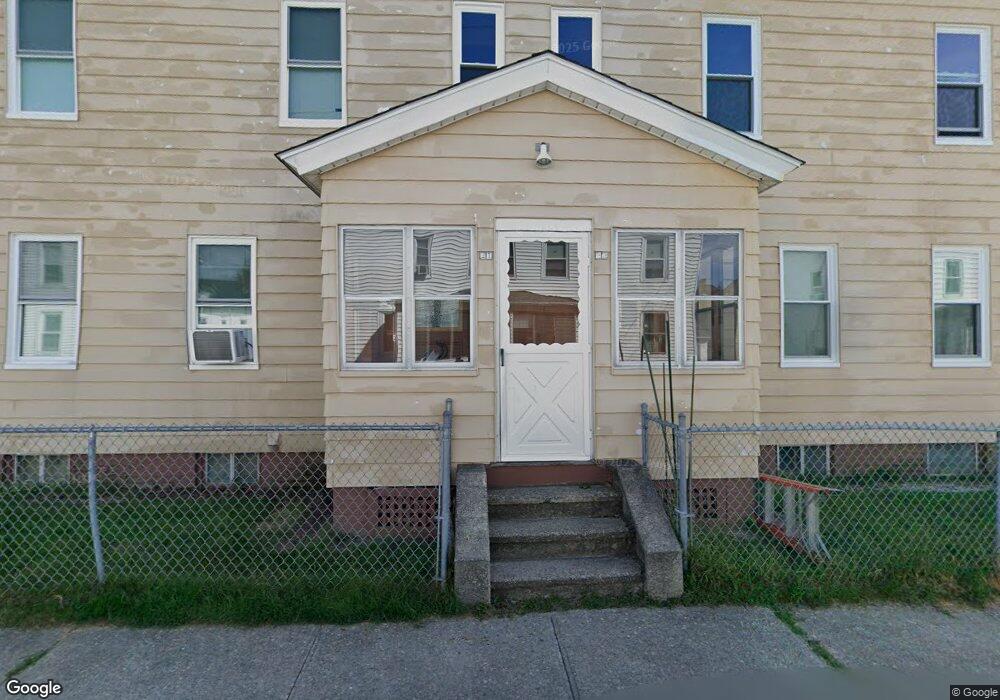
21 Exeter St Unit 23 Easthampton, MA 01027
Estimated Value: $459,000 - $509,000
6
Beds
4
Baths
2,834
Sq Ft
$169/Sq Ft
Est. Value
About This Home
This home is located at 21 Exeter St Unit 23, Easthampton, MA 01027 and is currently estimated at $479,761, approximately $169 per square foot. 21 Exeter St Unit 23 is a home located in Hampshire County with nearby schools including Easthampton High School, Hilltown Cooperative Charter Public School, and Tri-County Schools.
Ownership History
Date
Name
Owned For
Owner Type
Purchase Details
Closed on
Jun 15, 2018
Sold by
Barron Lindsay R
Bought by
Oneil Bethany
Current Estimated Value
Home Financials for this Owner
Home Financials are based on the most recent Mortgage that was taken out on this home.
Original Mortgage
$319,488
Outstanding Balance
$273,960
Interest Rate
4.5%
Mortgage Type
VA
Estimated Equity
$205,801
Purchase Details
Closed on
Apr 12, 2013
Sold by
Kwiecinski Stanley J and Kwiecinski Teresa A
Bought by
Barron Lindsay R
Home Financials for this Owner
Home Financials are based on the most recent Mortgage that was taken out on this home.
Original Mortgage
$176,739
Interest Rate
3.55%
Mortgage Type
New Conventional
Purchase Details
Closed on
Sep 10, 1990
Sold by
Bednarz Anna S
Bought by
Kwiecinski William J
Create a Home Valuation Report for This Property
The Home Valuation Report is an in-depth analysis detailing your home's value as well as a comparison with similar homes in the area
Home Values in the Area
Average Home Value in this Area
Purchase History
| Date | Buyer | Sale Price | Title Company |
|---|---|---|---|
| Oneil Bethany | $312,000 | -- | |
| Barron Lindsay R | $180,000 | -- | |
| Kwiecinski William J | $66,500 | -- |
Source: Public Records
Mortgage History
| Date | Status | Borrower | Loan Amount |
|---|---|---|---|
| Open | Oneil Bethany | $319,488 | |
| Previous Owner | Kwiecinski William J | $176,739 | |
| Previous Owner | Kwiecinski William J | $50,000 | |
| Previous Owner | Kwiecinski William J | $31,000 |
Source: Public Records
Tax History
| Year | Tax Paid | Tax Assessment Tax Assessment Total Assessment is a certain percentage of the fair market value that is determined by local assessors to be the total taxable value of land and additions on the property. | Land | Improvement |
|---|---|---|---|---|
| 2025 | $6,146 | $449,600 | $85,500 | $364,100 |
| 2024 | $5,923 | $436,800 | $83,000 | $353,800 |
| 2023 | $4,421 | $301,800 | $65,500 | $236,300 |
| 2022 | $4,989 | $301,800 | $65,500 | $236,300 |
| 2021 | $6,139 | $299,300 | $65,500 | $233,800 |
| 2020 | $5,360 | $301,800 | $65,500 | $236,300 |
| 2019 | $3,752 | $242,700 | $65,500 | $177,200 |
| 2018 | $3,283 | $205,200 | $61,700 | $143,500 |
| 2017 | $3,219 | $198,600 | $59,300 | $139,300 |
| 2016 | $3,193 | $204,800 | $59,300 | $145,500 |
| 2015 | $3,103 | $204,800 | $59,300 | $145,500 |
Source: Public Records
Map
Nearby Homes
- 18-20 Oakdale Place
- 12 Glen Cove Place Unit B
- 10 Glen Cove Place Unit A
- 29 Parsons St Unit 1
- 33 Knipfer Ave
- 2 Oak St
- 40 Clark St
- 7 Union Ct
- 19 Nicols Way Unit 19
- 4 Gaugh St
- 11 Dragon Cir
- 26 Winter St
- 6 Wilton Rd
- 296 Old Wilson Rd
- M143 &152 Glendale St
- 385 Main St
- 131 West St Unit 131
- 41 South St Unit 11
- 336 Main St
- 967 Florence Rd
- 21-23 Exeter St
- 25 Exeter St Unit 27
- 18 Federal St
- 20 Federal St
- 26-28 Federal St
- 20 Exeter St
- 22 Exeter St Unit 24
- 18 Exeter St
- 15 Exeter St
- 13 Exeter St Unit 15
- 13 Exeter St
- 13 Exeter St
- 14-16 Federal St
- 26 Federal St Unit 28
- 26 Federal St Unit 2
- 26-28 Exeter St
- 26 Exeter St Unit 28
- 16 Exeter St
- 16 Exeter St Unit 16
- 16 Exeter St Unit 16 Exeter St
Your Personal Tour Guide
Ask me questions while you tour the home.