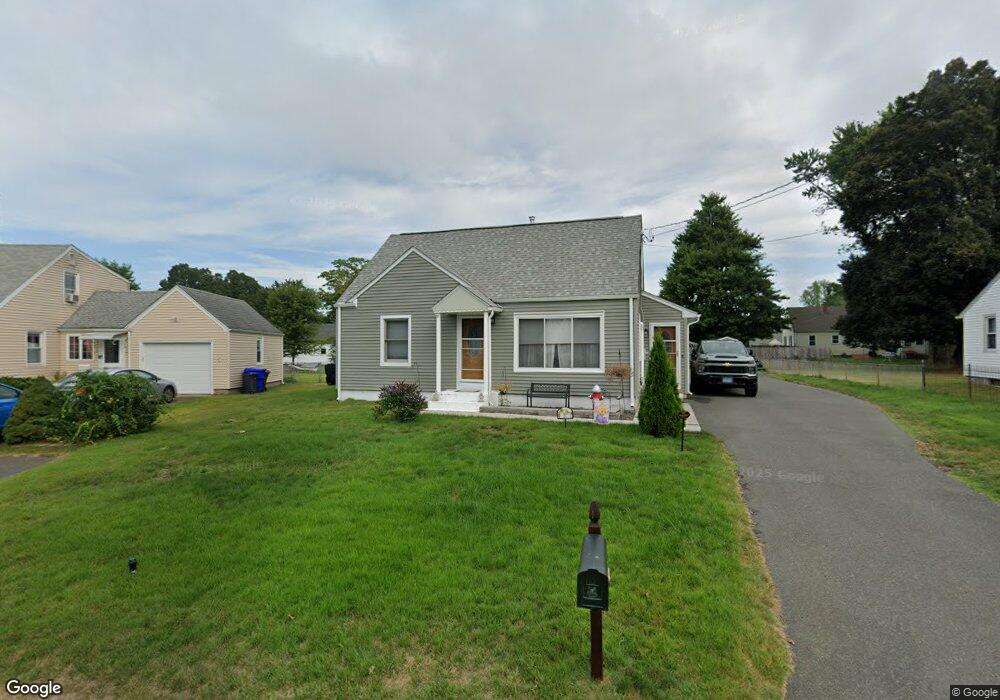
21 Freemont Rd Enfield, CT 06082
Estimated Value: $289,083 - $314,000
2
Beds
1
Bath
1,362
Sq Ft
$221/Sq Ft
Est. Value
About This Home
This home is located at 21 Freemont Rd, Enfield, CT 06082 and is currently estimated at $301,271, approximately $221 per square foot. 21 Freemont Rd is a home located in Hartford County with nearby schools including Prudence Crandall Elementary School, Henry Barnard Elementary School, and John F. Kennedy Middle School.
Ownership History
Date
Name
Owned For
Owner Type
Purchase Details
Closed on
Feb 29, 2016
Sold by
Mallory Pamela
Bought by
Deskis David
Current Estimated Value
Purchase Details
Closed on
Jul 3, 2013
Sold by
Deskis Jennifer M
Bought by
Deskis David T
Home Financials for this Owner
Home Financials are based on the most recent Mortgage that was taken out on this home.
Original Mortgage
$50,000
Interest Rate
3.59%
Purchase Details
Closed on
Nov 15, 1999
Sold by
Gonsorowski Christine
Bought by
Deskis David and Deskis Jennifer
Create a Home Valuation Report for This Property
The Home Valuation Report is an in-depth analysis detailing your home's value as well as a comparison with similar homes in the area
Home Values in the Area
Average Home Value in this Area
Purchase History
| Date | Buyer | Sale Price | Title Company |
|---|---|---|---|
| Deskis David | -- | -- | |
| Deskis David T | -- | -- | |
| Deskis David | $119,800 | -- |
Source: Public Records
Mortgage History
| Date | Status | Borrower | Loan Amount |
|---|---|---|---|
| Open | Deskis David | $100,000 | |
| Closed | Deskis David | $49,000 | |
| Previous Owner | Deskis David | $50,000 |
Source: Public Records
Tax History Compared to Growth
Tax History
| Year | Tax Paid | Tax Assessment Tax Assessment Total Assessment is a certain percentage of the fair market value that is determined by local assessors to be the total taxable value of land and additions on the property. | Land | Improvement |
|---|---|---|---|---|
| 2025 | $5,080 | $146,600 | $47,300 | $99,300 |
| 2024 | $4,957 | $146,600 | $47,300 | $99,300 |
| 2023 | $4,876 | $146,600 | $47,300 | $99,300 |
| 2022 | $4,484 | $146,600 | $47,300 | $99,300 |
| 2021 | $4,313 | $115,370 | $39,220 | $76,150 |
| 2020 | $4,313 | $115,370 | $39,220 | $76,150 |
| 2019 | $3,597 | $96,240 | $39,220 | $57,020 |
| 2018 | $3,518 | $96,240 | $39,220 | $57,020 |
| 2017 | $3,328 | $96,240 | $39,220 | $57,020 |
| 2016 | $3,227 | $94,870 | $39,220 | $55,650 |
| 2015 | $3,135 | $94,870 | $39,220 | $55,650 |
| 2014 | $3,062 | $94,870 | $39,220 | $55,650 |
Source: Public Records
Map
Nearby Homes