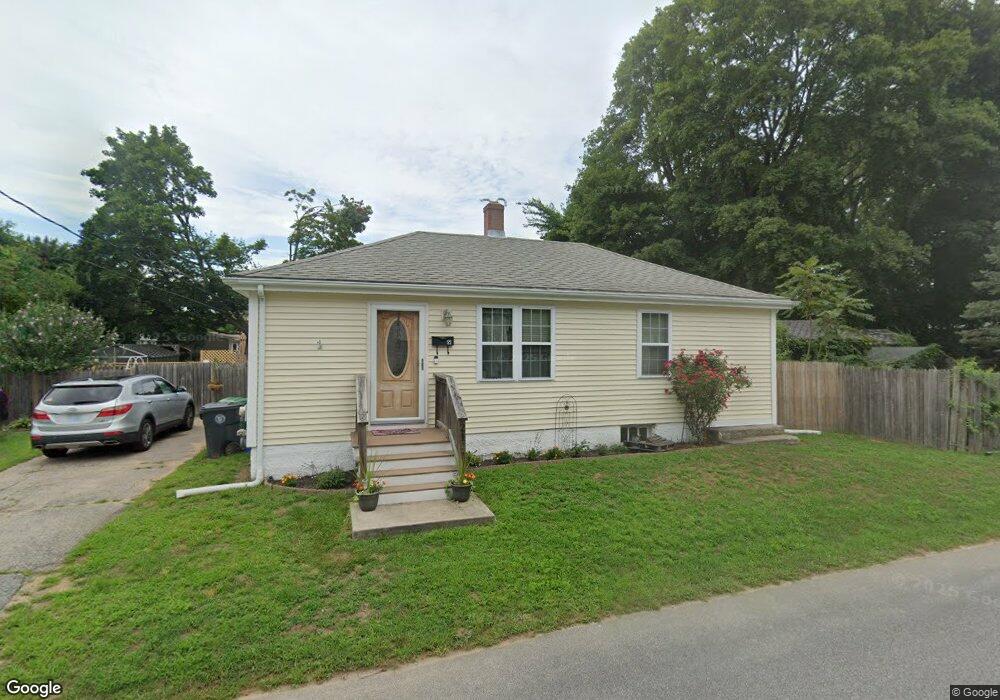
21 Fuller St Warwick, RI 02889
Conimicut-Shawomet NeighborhoodEstimated Value: $317,000 - $333,095
2
Beds
1
Bath
756
Sq Ft
$434/Sq Ft
Est. Value
About This Home
This home is located at 21 Fuller St, Warwick, RI 02889 and is currently estimated at $328,274, approximately $434 per square foot. 21 Fuller St is a home located in Kent County with nearby schools including Saint Kevin School and Bishop Hendricken High School.
Ownership History
Date
Name
Owned For
Owner Type
Purchase Details
Closed on
Sep 8, 2021
Sold by
Kempf Lisa A
Bought by
Kempf Lisa A
Current Estimated Value
Home Financials for this Owner
Home Financials are based on the most recent Mortgage that was taken out on this home.
Original Mortgage
$178,571
Outstanding Balance
$161,776
Interest Rate
2.8%
Mortgage Type
FHA
Estimated Equity
$166,498
Purchase Details
Closed on
Apr 14, 2014
Sold by
Salisbury James and Salisbury Jennife R
Bought by
Stpierre Lisa A
Home Financials for this Owner
Home Financials are based on the most recent Mortgage that was taken out on this home.
Original Mortgage
$122,244
Interest Rate
4.37%
Mortgage Type
New Conventional
Purchase Details
Closed on
Jan 23, 2014
Sold by
Markovich Michael and Salisbury James
Bought by
Salisbury James and Salisbury Jennifer A
Purchase Details
Closed on
Mar 26, 2013
Sold by
Salisbury James
Bought by
Salisbury James and Salisbury Jennifer A
Purchase Details
Closed on
Feb 27, 2009
Sold by
Wells Fargo Bank Na
Bought by
Salisbury James
Purchase Details
Closed on
Mar 30, 2006
Sold by
Mcnamara Patrick M and Mcnamara Eudora D
Bought by
Markovich Michael and Gilbert Elizabeth
Purchase Details
Closed on
Feb 2, 1998
Sold by
Chadronet Thomas and Chadronet Eleanor
Bought by
Mcnamara Patrick M
Create a Home Valuation Report for This Property
The Home Valuation Report is an in-depth analysis detailing your home's value as well as a comparison with similar homes in the area
Home Values in the Area
Average Home Value in this Area
Purchase History
| Date | Buyer | Sale Price | Title Company |
|---|---|---|---|
| Kempf Lisa A | -- | None Available | |
| Stpierre Lisa A | $124,500 | -- | |
| Salisbury James | $140,000 | -- | |
| Salisbury James | -- | -- | |
| Salisbury James | $140,000 | -- | |
| Salisbury James | $40,000 | -- | |
| Markovich Michael | $176,000 | -- | |
| Mcnamara Patrick M | $67,000 | -- |
Source: Public Records
Mortgage History
| Date | Status | Borrower | Loan Amount |
|---|---|---|---|
| Open | Kempf Lisa A | $178,571 | |
| Previous Owner | Mcnamara Patrick M | $122,244 | |
| Previous Owner | Mcnamara Patrick M | $4,357 |
Source: Public Records
Tax History
| Year | Tax Paid | Tax Assessment Tax Assessment Total Assessment is a certain percentage of the fair market value that is determined by local assessors to be the total taxable value of land and additions on the property. | Land | Improvement |
|---|---|---|---|---|
| 2025 | $3,444 | $271,200 | $100,000 | $171,200 |
| 2024 | $3,199 | $221,100 | $82,600 | $138,500 |
| 2023 | $3,137 | $221,100 | $82,600 | $138,500 |
| 2022 | $2,886 | $154,100 | $49,600 | $104,500 |
| 2021 | $2,886 | $154,100 | $49,600 | $104,500 |
| 2020 | $2,886 | $154,100 | $49,600 | $104,500 |
| 2019 | $2,886 | $154,100 | $49,600 | $104,500 |
| 2018 | $2,340 | $115,600 | $49,600 | $66,000 |
| 2017 | $2,340 | $115,600 | $49,600 | $66,000 |
| 2016 | $2,340 | $115,600 | $49,600 | $66,000 |
| 2015 | $2,320 | $111,800 | $57,500 | $54,300 |
| 2014 | $2,243 | $111,800 | $57,500 | $54,300 |
| 2013 | $2,213 | $111,800 | $57,500 | $54,300 |
Source: Public Records
Map
Nearby Homes
Your Personal Tour Guide
Ask me questions while you tour the home.