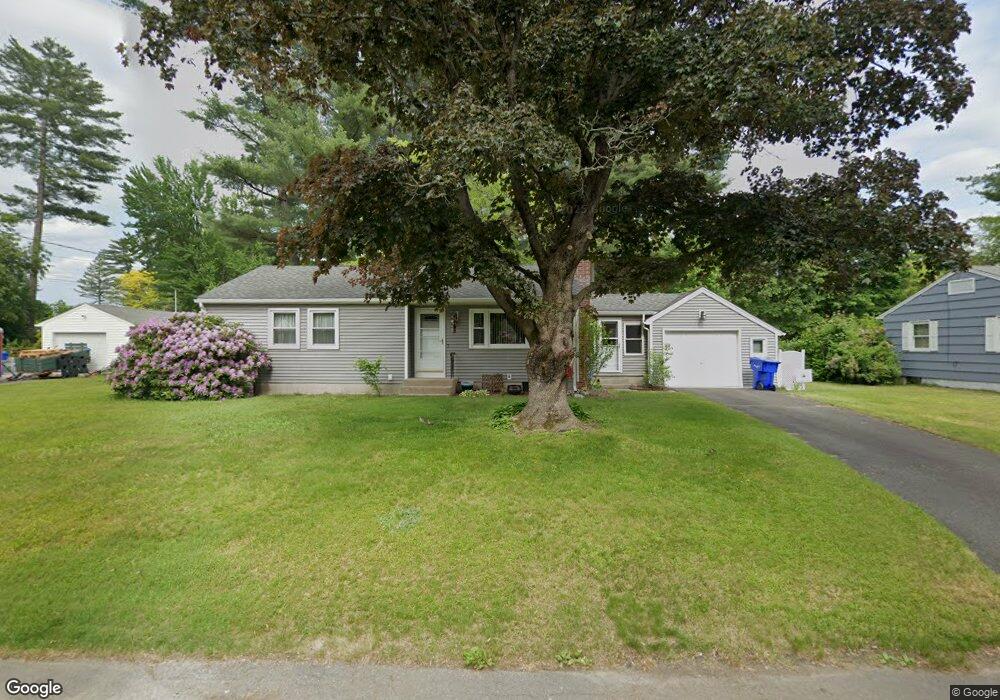
21 Garcia St Springfield, MA 01129
Boston Road NeighborhoodEstimated Value: $310,126 - $313,000
3
Beds
1
Bath
1,004
Sq Ft
$311/Sq Ft
Est. Value
About This Home
This home is located at 21 Garcia St, Springfield, MA 01129 and is currently estimated at $312,032, approximately $310 per square foot. 21 Garcia St is a home located in Hampden County with nearby schools including Warner, M Marcus Kiley Middle, and Springfield Central High School.
Ownership History
Date
Name
Owned For
Owner Type
Purchase Details
Closed on
May 17, 1993
Sold by
Ryan Florence E and Ryan John J
Bought by
Moller Anne M
Current Estimated Value
Home Financials for this Owner
Home Financials are based on the most recent Mortgage that was taken out on this home.
Original Mortgage
$64,000
Interest Rate
7.47%
Mortgage Type
Purchase Money Mortgage
Create a Home Valuation Report for This Property
The Home Valuation Report is an in-depth analysis detailing your home's value as well as a comparison with similar homes in the area
Home Values in the Area
Average Home Value in this Area
Purchase History
| Date | Buyer | Sale Price | Title Company |
|---|---|---|---|
| Moller Anne M | $80,000 | -- |
Source: Public Records
Mortgage History
| Date | Status | Borrower | Loan Amount |
|---|---|---|---|
| Open | Moller Anne M | $66,000 | |
| Closed | Moller Anne M | $65,000 | |
| Closed | Moller Anne M | $64,000 |
Source: Public Records
Tax History Compared to Growth
Tax History
| Year | Tax Paid | Tax Assessment Tax Assessment Total Assessment is a certain percentage of the fair market value that is determined by local assessors to be the total taxable value of land and additions on the property. | Land | Improvement |
|---|---|---|---|---|
| 2025 | $4,196 | $267,600 | $58,200 | $209,400 |
| 2024 | $4,293 | $267,300 | $58,200 | $209,100 |
| 2023 | $3,560 | $208,800 | $55,400 | $153,400 |
| 2022 | $3,800 | $201,900 | $55,400 | $146,500 |
| 2021 | $3,457 | $182,900 | $50,300 | $132,600 |
| 2020 | $3,275 | $167,700 | $50,300 | $117,400 |
| 2019 | $3,027 | $153,800 | $50,300 | $103,500 |
| 2018 | $3,017 | $153,300 | $50,300 | $103,000 |
| 2017 | $2,831 | $144,000 | $45,300 | $98,700 |
| 2016 | $2,790 | $141,900 | $45,300 | $96,600 |
| 2015 | $2,797 | $142,200 | $45,300 | $96,900 |
Source: Public Records
Map
Nearby Homes