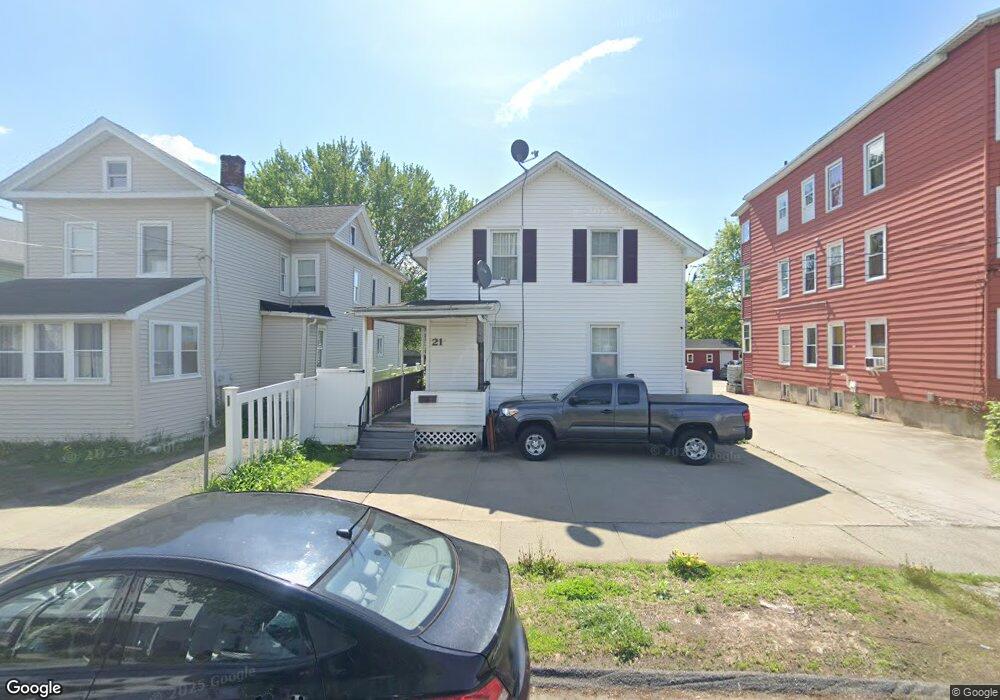
21 George St West Springfield, MA 01089
Estimated Value: $294,000 - $323,000
3
Beds
1
Bath
1,535
Sq Ft
$198/Sq Ft
Est. Value
About This Home
This home is located at 21 George St, West Springfield, MA 01089 and is currently estimated at $304,016, approximately $198 per square foot. 21 George St is a home located in Hampden County with nearby schools including West Springfield High School, Hampden Charter School of Science West, and Libertas Academy Charter School.
Ownership History
Date
Name
Owned For
Owner Type
Purchase Details
Closed on
Feb 2, 2018
Sold by
Mousa Ali I
Bought by
Mousa Ali I and Bdawe Hidwaat H
Current Estimated Value
Purchase Details
Closed on
Nov 27, 2002
Sold by
Asta-Ferrero Merle W
Bought by
Mousa Ali I
Home Financials for this Owner
Home Financials are based on the most recent Mortgage that was taken out on this home.
Original Mortgage
$67,803
Interest Rate
6.16%
Mortgage Type
Purchase Money Mortgage
Create a Home Valuation Report for This Property
The Home Valuation Report is an in-depth analysis detailing your home's value as well as a comparison with similar homes in the area
Home Values in the Area
Average Home Value in this Area
Purchase History
| Date | Buyer | Sale Price | Title Company |
|---|---|---|---|
| Mousa Ali I | -- | -- | |
| Mousa Ali I | $69,900 | -- |
Source: Public Records
Mortgage History
| Date | Status | Borrower | Loan Amount |
|---|---|---|---|
| Previous Owner | Mousa Ali I | $67,803 |
Source: Public Records
Tax History
| Year | Tax Paid | Tax Assessment Tax Assessment Total Assessment is a certain percentage of the fair market value that is determined by local assessors to be the total taxable value of land and additions on the property. | Land | Improvement |
|---|---|---|---|---|
| 2025 | $3,768 | $253,400 | $94,000 | $159,400 |
| 2024 | $3,543 | $239,200 | $94,000 | $145,200 |
| 2023 | $3,209 | $206,500 | $84,500 | $122,000 |
| 2022 | $2,963 | $188,000 | $76,700 | $111,300 |
| 2021 | $2,868 | $169,700 | $69,700 | $100,000 |
| 2020 | $2,817 | $165,800 | $69,700 | $96,100 |
| 2019 | $2,812 | $165,800 | $69,700 | $96,100 |
| 2018 | $2,827 | $165,800 | $69,700 | $96,100 |
| 2017 | $2,827 | $165,800 | $69,700 | $96,100 |
| 2016 | $2,773 | $163,200 | $67,100 | $96,100 |
| 2015 | $2,499 | $147,100 | $65,700 | $81,400 |
| 2014 | $605 | $147,100 | $65,700 | $81,400 |
Source: Public Records
Map
Nearby Homes
Your Personal Tour Guide
Ask me questions while you tour the home.