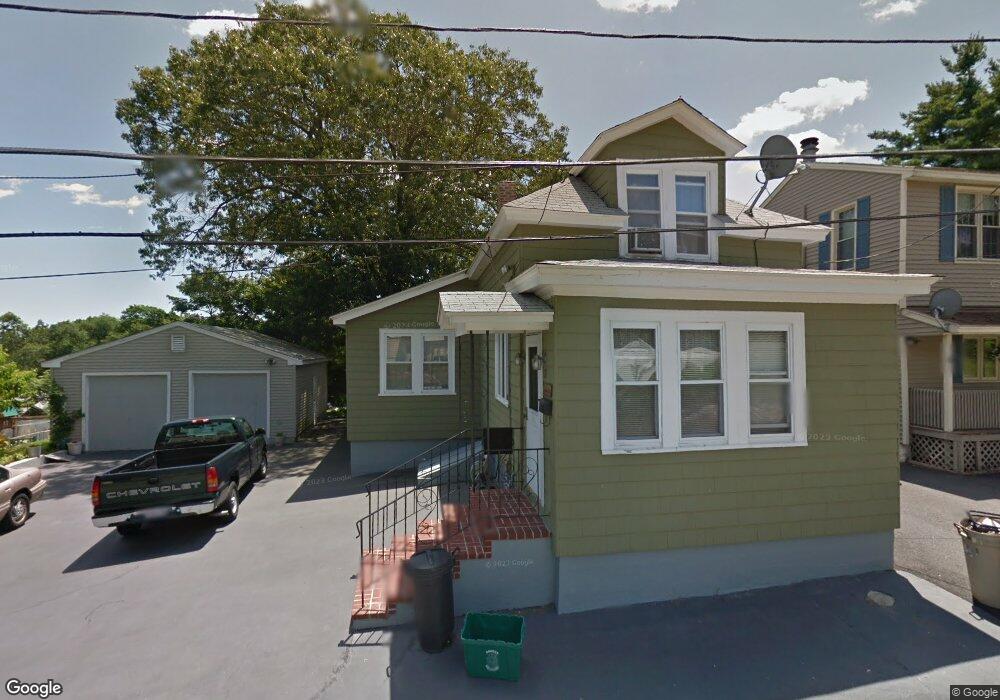
21 Glennon Ave Dracut, MA 01826
Estimated Value: $506,000 - $644,000
3
Beds
2
Baths
1,305
Sq Ft
$418/Sq Ft
Est. Value
About This Home
This home is located at 21 Glennon Ave, Dracut, MA 01826 and is currently estimated at $545,375, approximately $417 per square foot. 21 Glennon Ave is a home located in Middlesex County with nearby schools including George H. Englesby Elementary School, Richardson Middle School, and Dracut Senior High School.
Ownership History
Date
Name
Owned For
Owner Type
Purchase Details
Closed on
Nov 21, 2023
Sold by
Demetrios E Tamvaklis Lt and Tamvaklis
Bought by
Tamvaklis Demetrios E
Current Estimated Value
Purchase Details
Closed on
Sep 26, 2023
Sold by
Tamvaklis Demetrios E
Bought by
Demetrios E Tamvaklis Lt and Tamvaklis
Purchase Details
Closed on
Dec 7, 2021
Sold by
Tamvaklis Demetrios E
Bought by
D E Tamvaklis 2021 Irt and Tamvaklis
Purchase Details
Closed on
Jul 22, 2016
Sold by
Tamvaklis Demetrios E and Tamvaklis Athanasia
Bought by
Tamvaklis Demetrios E
Purchase Details
Closed on
Oct 29, 2004
Sold by
Tamvaklis Athanasia
Bought by
Tamvaklis Athanasia and Tamvaklis Demetrios E
Purchase Details
Closed on
Feb 23, 1979
Bought by
Tamvaklis Demetrios E
Create a Home Valuation Report for This Property
The Home Valuation Report is an in-depth analysis detailing your home's value as well as a comparison with similar homes in the area
Home Values in the Area
Average Home Value in this Area
Purchase History
| Date | Buyer | Sale Price | Title Company |
|---|---|---|---|
| Tamvaklis Demetrios E | -- | None Available | |
| Demetrios E Tamvaklis Lt | -- | None Available | |
| D E Tamvaklis 2021 Irt | -- | None Available | |
| Tamvaklis Demetrios E | -- | -- | |
| Tamvaklis Athanasia | -- | -- | |
| Tamvaklis Demetrios E | -- | -- |
Source: Public Records
Mortgage History
| Date | Status | Borrower | Loan Amount |
|---|---|---|---|
| Previous Owner | Tamvaklis Demetrios E | $70,000 |
Source: Public Records
Tax History
| Year | Tax Paid | Tax Assessment Tax Assessment Total Assessment is a certain percentage of the fair market value that is determined by local assessors to be the total taxable value of land and additions on the property. | Land | Improvement |
|---|---|---|---|---|
| 2025 | $4,362 | $431,000 | $188,400 | $242,600 |
| 2024 | $4,103 | $392,600 | $179,400 | $213,200 |
| 2023 | $4,275 | $369,200 | $156,000 | $213,200 |
| 2022 | $4,043 | $329,000 | $141,800 | $187,200 |
| 2021 | $3,824 | $293,900 | $128,900 | $165,000 |
| 2020 | $3,703 | $277,400 | $125,200 | $152,200 |
| 2019 | $3,535 | $257,100 | $119,200 | $137,900 |
| 2018 | $3,586 | $253,600 | $119,200 | $134,400 |
| 2017 | $3,489 | $253,600 | $119,200 | $134,400 |
| 2016 | $3,293 | $221,900 | $114,600 | $107,300 |
| 2015 | $3,135 | $210,000 | $114,600 | $95,400 |
| 2014 | $2,975 | $205,300 | $114,600 | $90,700 |
Source: Public Records
Map
Nearby Homes
- 67 Glennon Ave
- 109 Navy Yard Rd
- 2300 Skyline Dr Unit 3
- 1400 Skyline Dr Unit 6
- 101 Donohue Rd Unit 19
- 9 Arbor Dr
- 15 Louis Farm Rd Unit 15
- 94 Hampson St
- 105 Columbia Rd
- 91 Frederick St Unit 77
- 30 4th Ave
- 89 Mammoth Rd
- 42 Frederick St Unit 9
- 248 Acropolis Rd
- 94 Tennis Plaza Rd Unit 10
- 19 Louis Farm Rd Unit 19
- 13 Louis Farm Rd Unit 13
- 104 Woodward Ave
- 39 Phoebe Ave
- 28 Sarah Ave
Your Personal Tour Guide
Ask me questions while you tour the home.