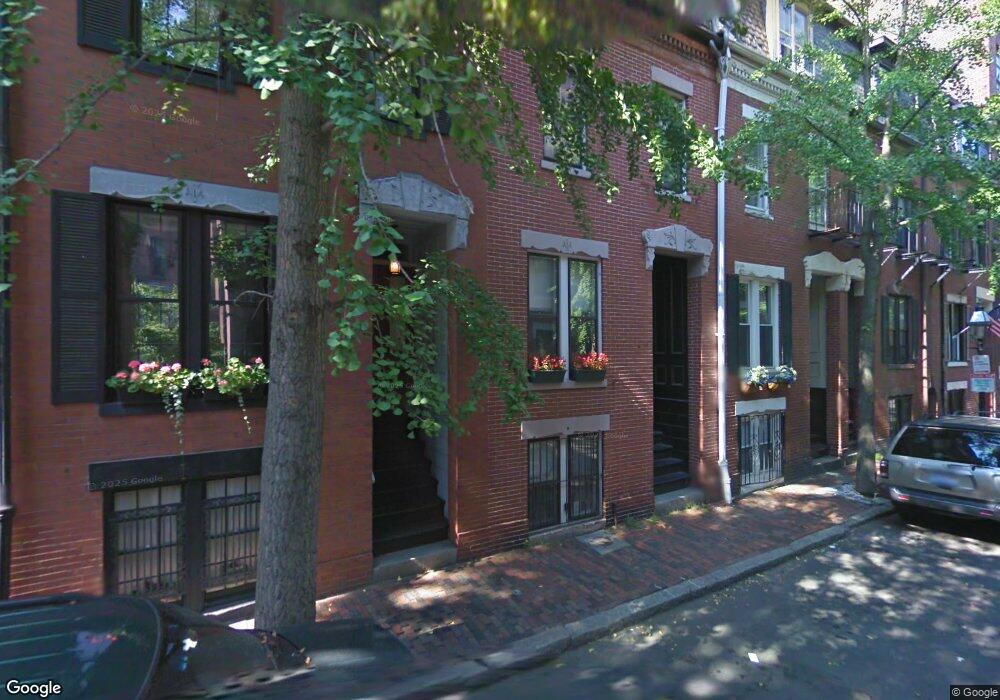
21 Gray St Boston, MA 02116
South End NeighborhoodEstimated Value: $2,075,000 - $2,796,000
5
Beds
3
Baths
1,912
Sq Ft
$1,271/Sq Ft
Est. Value
About This Home
This home is located at 21 Gray St, Boston, MA 02116 and is currently estimated at $2,430,894, approximately $1,271 per square foot. 21 Gray St is a home located in Suffolk County with nearby schools including Kingsley Montessori School, Cathedral High School, and Commonwealth School.
Ownership History
Date
Name
Owned For
Owner Type
Purchase Details
Closed on
Oct 1, 1993
Sold by
Scholes Sian K and Scholes Timothy J
Bought by
Gray St Nt 21
Current Estimated Value
Purchase Details
Closed on
Jun 10, 1988
Sold by
Apple Rt
Bought by
Scholes Timothy
Create a Home Valuation Report for This Property
The Home Valuation Report is an in-depth analysis detailing your home's value as well as a comparison with similar homes in the area
Home Values in the Area
Average Home Value in this Area
Purchase History
| Date | Buyer | Sale Price | Title Company |
|---|---|---|---|
| Gray St Nt 21 | $365,000 | -- | |
| Gray St Nt 21 | $365,000 | -- | |
| Scholes Timothy | $370,000 | -- |
Source: Public Records
Mortgage History
| Date | Status | Borrower | Loan Amount |
|---|---|---|---|
| Previous Owner | Scholes Timothy | $25,000 | |
| Closed | Scholes Timothy | $0 |
Source: Public Records
Tax History Compared to Growth
Tax History
| Year | Tax Paid | Tax Assessment Tax Assessment Total Assessment is a certain percentage of the fair market value that is determined by local assessors to be the total taxable value of land and additions on the property. | Land | Improvement |
|---|---|---|---|---|
| 2025 | $20,887 | $1,803,700 | $481,300 | $1,322,400 |
| 2024 | $20,276 | $1,860,200 | $512,200 | $1,348,000 |
| 2023 | $19,211 | $1,788,700 | $492,500 | $1,296,200 |
| 2022 | $18,720 | $1,720,600 | $473,800 | $1,246,800 |
| 2021 | $17,318 | $1,623,100 | $446,900 | $1,176,200 |
| 2020 | $16,602 | $1,572,200 | $405,700 | $1,166,500 |
| 2019 | $16,094 | $1,526,900 | $336,000 | $1,190,900 |
| 2018 | $15,541 | $1,482,900 | $336,000 | $1,146,900 |
| 2017 | $14,950 | $1,411,700 | $336,000 | $1,075,700 |
| 2016 | $14,246 | $1,295,100 | $336,000 | $959,100 |
| 2015 | $14,866 | $1,227,600 | $286,400 | $941,200 |
| 2014 | $13,788 | $1,096,000 | $286,400 | $809,600 |
Source: Public Records
Map
Nearby Homes
- 27 Appleton St
- 7 Warren Ave Unit 19
- 9 Appleton St Unit 408
- 74 Appleton St Unit 5
- 82 Berkeley St Unit 5
- 77 Chandler St Unit 1
- 75 Appleton St Unit 3
- 80 Appleton St
- 36 Milford St Unit 1
- 34 Lawrence St Unit 2
- 17 Cazenove St Unit 404
- 2 Clarendon St Unit 401
- 2 Clarendon St Unit 606
- 70 Clarendon St Unit 1
- 75 Clarendon St Unit 505
- 37 Lawrence St Unit 16
- 18 Milford St Unit 1
- 18 Milford St Unit 2
- 34 Dwight St Unit 1
- 109 Appleton St
- 23 Gray St
- 19 Gray St Unit 2
- 19 Gray St Unit 1
- 19 Gray St
- 25 Gray St
- 25 Gray St Unit 1
- 17 Gray St
- 17 Gray St Unit 1
- 17 Gray St Unit 2
- 27 Gray St
- 15 Gray St Unit 2
- 15 Gray St Unit 1
- 22 Appleton St
- 22 Appleton St
- 22 Appleton St Unit 2
- 22 Appleton St Unit 1
- 24 Appleton St Unit 2
- 24 Appleton St Unit 3
- 24 Appleton St Unit SF
- 24 Appleton St