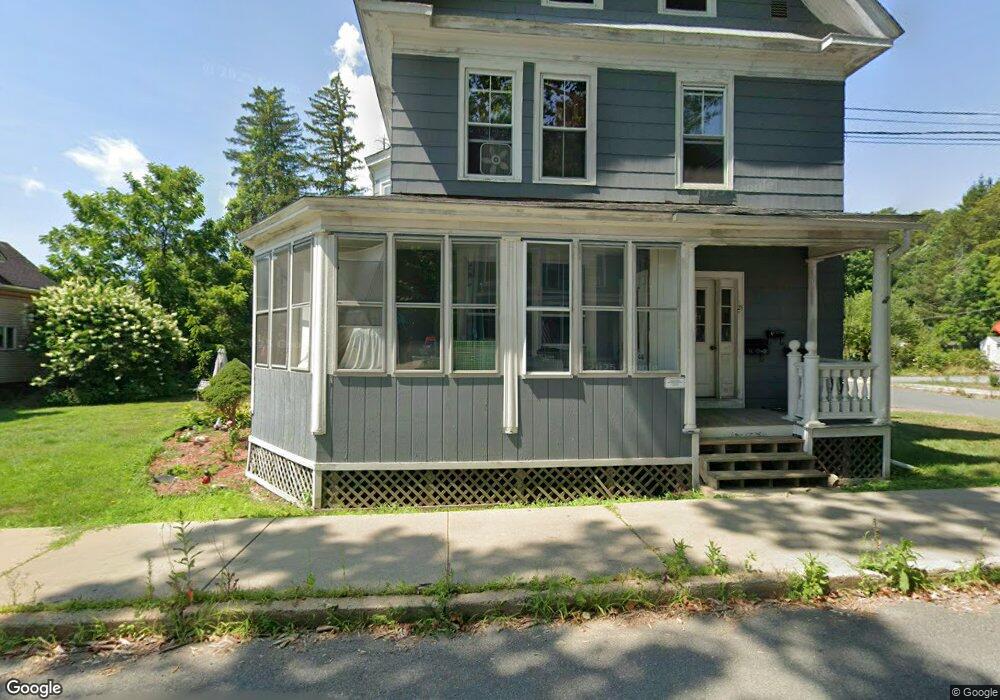
21 Grove St Orange, MA 01364
Estimated Value: $257,000 - $292,000
6
Beds
3
Baths
2,858
Sq Ft
$97/Sq Ft
Est. Value
About This Home
This home is located at 21 Grove St, Orange, MA 01364 and is currently estimated at $276,000, approximately $96 per square foot. 21 Grove St is a home located in Franklin County with nearby schools including Fisher Hill and Ralph C Mahar Regional.
Ownership History
Date
Name
Owned For
Owner Type
Purchase Details
Closed on
May 4, 2007
Sold by
Community Economi Assi and Millers River Ctr Regi
Bought by
P & G Llc
Current Estimated Value
Home Financials for this Owner
Home Financials are based on the most recent Mortgage that was taken out on this home.
Original Mortgage
$602,561
Outstanding Balance
$367,718
Interest Rate
6.23%
Mortgage Type
Purchase Money Mortgage
Estimated Equity
-$91,718
Create a Home Valuation Report for This Property
The Home Valuation Report is an in-depth analysis detailing your home's value as well as a comparison with similar homes in the area
Home Values in the Area
Average Home Value in this Area
Purchase History
| Date | Buyer | Sale Price | Title Company |
|---|---|---|---|
| P & G Llc | $246,500 | -- | |
| P&G Llc | $246,500 | -- |
Source: Public Records
Mortgage History
| Date | Status | Borrower | Loan Amount |
|---|---|---|---|
| Open | P&G Llc | $602,561 | |
| Closed | P & G Llc | $602,561 | |
| Previous Owner | P & G Llc | $33,875 | |
| Previous Owner | P & G Llc | $30,000 |
Source: Public Records
Tax History Compared to Growth
Tax History
| Year | Tax Paid | Tax Assessment Tax Assessment Total Assessment is a certain percentage of the fair market value that is determined by local assessors to be the total taxable value of land and additions on the property. | Land | Improvement |
|---|---|---|---|---|
| 2025 | $31 | $187,700 | $26,100 | $161,600 |
| 2024 | $3,315 | $190,100 | $26,100 | $164,000 |
| 2023 | $3,368 | $187,500 | $23,500 | $164,000 |
| 2022 | $3,090 | $161,600 | $23,500 | $138,100 |
| 2021 | $3,350 | $167,100 | $43,300 | $123,800 |
| 2020 | $2,897 | $142,500 | $39,500 | $103,000 |
| 2019 | $2,856 | $126,800 | $34,200 | $92,600 |
| 2018 | $2,865 | $130,600 | $31,900 | $98,700 |
| 2017 | $2,773 | $130,600 | $31,900 | $98,700 |
| 2016 | $2,550 | $117,500 | $28,500 | $89,000 |
| 2015 | $2,746 | $132,200 | $30,400 | $101,800 |
| 2014 | $3,147 | $159,400 | $30,400 | $129,000 |
Source: Public Records
Map
Nearby Homes
- 35 Winter St
- 36 Summit St Unit B
- 36 Summit St Unit A
- 78-80 High St
- 43 W Main St
- 35 W River St
- 114 S Main St
- 73-75 Pleasant St
- 67 Putnam St
- 65 E Myrtle St
- 75 E Myrtle St
- 111 Hayden St
- 121 Pleasant St
- 84 Walnut Hill Rd
- 39 Terrace St
- 29 Terrace St
- 257 S Main St
- 276 Pleasant St
- 519 E River St Unit 23
- 00 S Main St