Estimated Value: $224,233 - $372,000
3
Beds
1
Bath
948
Sq Ft
$289/Sq Ft
Est. Value
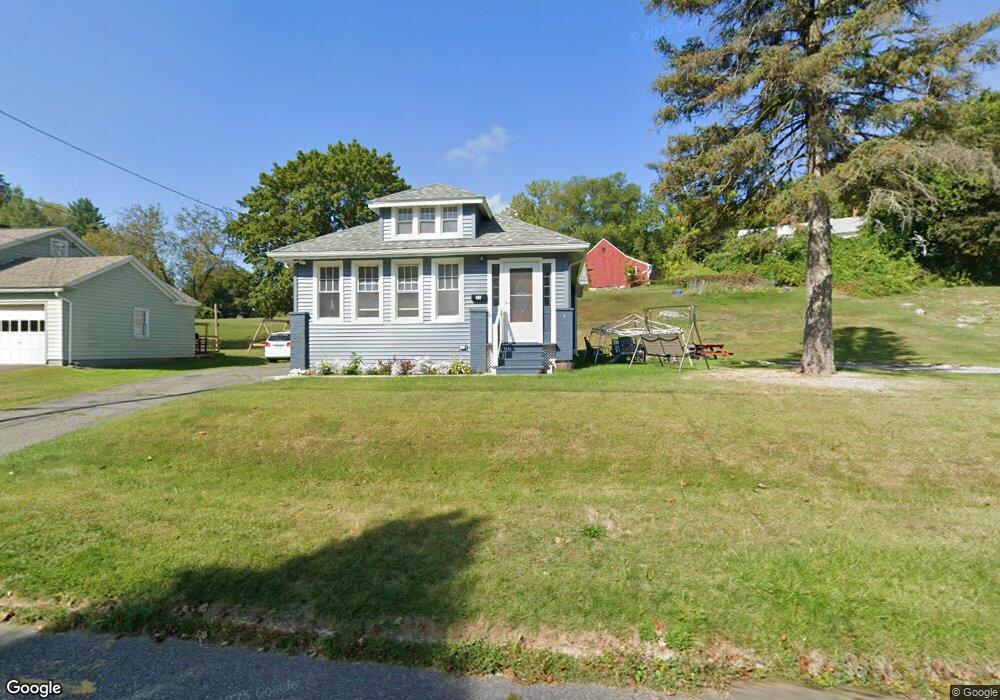
About This Home
This home is located at 21 Harding Ave, Adams, MA 01220 and is currently estimated at $274,058, approximately $289 per square foot. 21 Harding Ave is a home located in Berkshire County with nearby schools including Hoosac Valley Middle & High School, Berkshire Arts & Technology Charter Public School, and St. Stanislaus Kostka School.
Ownership History
Date
Name
Owned For
Owner Type
Purchase Details
Closed on
Sep 29, 1995
Sold by
Obrien Winifred Mary
Bought by
Field Kelly J
Current Estimated Value
Home Financials for this Owner
Home Financials are based on the most recent Mortgage that was taken out on this home.
Original Mortgage
$93,280
Outstanding Balance
$673
Interest Rate
7.89%
Mortgage Type
Purchase Money Mortgage
Estimated Equity
$273,385
Create a Home Valuation Report for This Property
The Home Valuation Report is an in-depth analysis detailing your home's value as well as a comparison with similar homes in the area
Home Values in the Area
Average Home Value in this Area
Purchase History
| Date | Buyer | Sale Price | Title Company |
|---|---|---|---|
| Field Kelly J | $93,000 | -- |
Source: Public Records
Mortgage History
| Date | Status | Borrower | Loan Amount |
|---|---|---|---|
| Open | Field Kelly J | $93,280 |
Source: Public Records
Tax History Compared to Growth
Tax History
| Year | Tax Paid | Tax Assessment Tax Assessment Total Assessment is a certain percentage of the fair market value that is determined by local assessors to be the total taxable value of land and additions on the property. | Land | Improvement |
|---|---|---|---|---|
| 2025 | $3,365 | $197,800 | $55,100 | $142,700 |
| 2024 | $3,182 | $181,400 | $51,800 | $129,600 |
| 2023 | $2,985 | $160,900 | $47,100 | $113,800 |
| 2022 | $2,975 | $142,400 | $41,000 | $101,400 |
| 2021 | $2,936 | $129,800 | $41,000 | $88,800 |
| 2020 | $2,816 | $128,700 | $41,700 | $87,000 |
| 2019 | $2,753 | $128,700 | $41,700 | $87,000 |
| 2018 | $2,823 | $127,100 | $41,700 | $85,400 |
| 2017 | $2,716 | $127,100 | $41,700 | $85,400 |
| 2016 | $2,633 | $123,100 | $41,700 | $81,400 |
| 2015 | $2,586 | $121,000 | $43,600 | $77,400 |
| 2014 | $2,414 | $121,000 | $43,600 | $77,400 |
Source: Public Records
Map
Nearby Homes