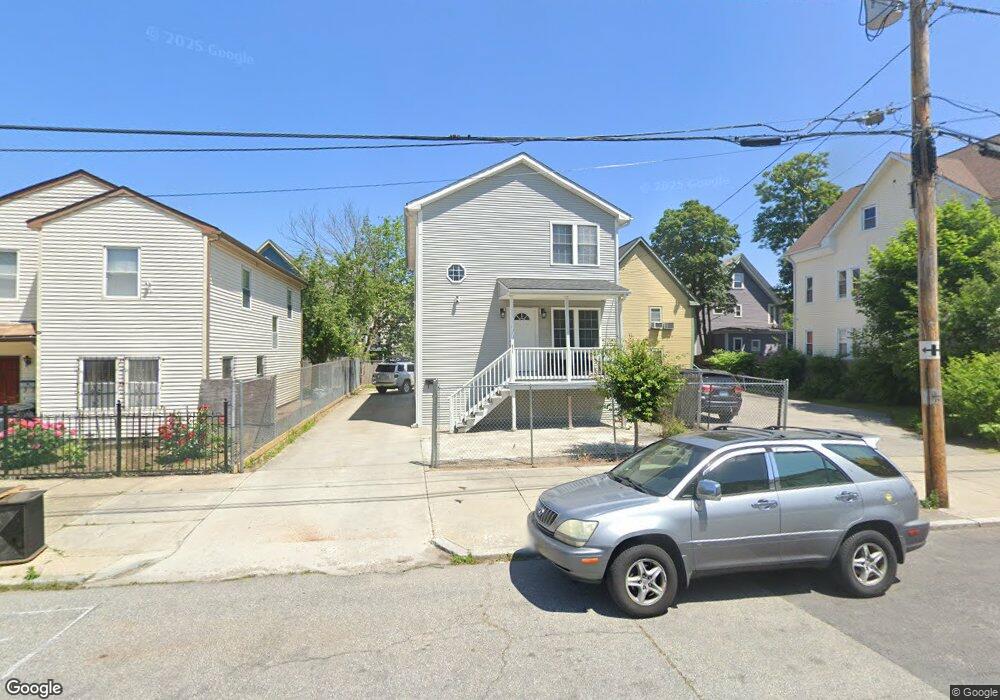
21 Harvard Ave Providence, RI 02907
Upper South Providence NeighborhoodEstimated Value: $292,000 - $476,000
4
Beds
3
Baths
2,376
Sq Ft
$165/Sq Ft
Est. Value
About This Home
This home is located at 21 Harvard Ave, Providence, RI 02907 and is currently estimated at $391,043, approximately $164 per square foot. 21 Harvard Ave is a home located in Providence County with nearby schools including Highlander Charter School, SouthSide Elementary Charter, and Bishop Mcvinney Elementary School.
Ownership History
Date
Name
Owned For
Owner Type
Purchase Details
Closed on
Dec 21, 2023
Sold by
Lim Susan H
Bought by
Morn Sokunna and Seng Srien
Current Estimated Value
Home Financials for this Owner
Home Financials are based on the most recent Mortgage that was taken out on this home.
Original Mortgage
$172,975
Outstanding Balance
$170,104
Interest Rate
7.5%
Mortgage Type
FHA
Estimated Equity
$220,939
Purchase Details
Closed on
Mar 21, 2007
Sold by
Sand Investments Team
Bought by
Lim Susan H
Home Financials for this Owner
Home Financials are based on the most recent Mortgage that was taken out on this home.
Original Mortgage
$152,000
Interest Rate
6.33%
Mortgage Type
Purchase Money Mortgage
Purchase Details
Closed on
Jun 13, 2006
Sold by
Thompson James A
Bought by
Sand Inv Team Llc
Create a Home Valuation Report for This Property
The Home Valuation Report is an in-depth analysis detailing your home's value as well as a comparison with similar homes in the area
Home Values in the Area
Average Home Value in this Area
Purchase History
We collect this data history from publicly available records. To have your information removed, we recommend requesting removal directly through your county’s website.
| Date | Buyer | Sale Price | Title Company |
|---|---|---|---|
| Morn Sokunna | $200,000 | None Available | |
| Lim Susan H | $190,000 | -- | |
| Sand Inv Team Llc | $47,000 | -- |
Source: Public Records
Mortgage History
We collect this data history from publicly available records. To have your information removed, we recommend requesting removal directly through your county’s website.
| Date | Status | Borrower | Loan Amount |
|---|---|---|---|
| Open | Morn Sokunna | $172,975 | |
| Previous Owner | Sand Inv Team Llc | $152,000 | |
| Previous Owner | Sand Inv Team Llc | $100,000 |
Source: Public Records
Tax History
| Year | Tax Paid | Tax Assessment Tax Assessment Total Assessment is a certain percentage of the fair market value that is determined by local assessors to be the total taxable value of land and additions on the property. | Land | Improvement |
|---|---|---|---|---|
| 2025 | $3,100 | $369,100 | $99,000 | $270,100 |
| 2024 | $5,110 | $278,500 | $55,400 | $223,100 |
| 2023 | $5,110 | $278,500 | $55,400 | $223,100 |
| 2022 | $4,957 | $278,500 | $55,400 | $223,100 |
| 2021 | $4,713 | $191,900 | $24,100 | $167,800 |
| 2020 | $4,713 | $191,900 | $24,100 | $167,800 |
| 2019 | $4,713 | $191,900 | $24,100 | $167,800 |
| 2018 | $4,283 | $134,000 | $21,900 | $112,100 |
| 2017 | $4,283 | $134,000 | $21,900 | $112,100 |
| 2016 | $4,283 | $134,000 | $21,900 | $112,100 |
| 2015 | $4,359 | $131,700 | $21,900 | $109,800 |
| 2014 | $4,445 | $131,700 | $21,900 | $109,800 |
| 2013 | $4,445 | $131,700 | $21,900 | $109,800 |
Source: Public Records
Map
Nearby Homes
- 113 Robinson St
- 221 Prairie Aka 104 Robinson Street Ave
- 236 Dudley St
- 512 Pine St Unit C3
- 3 Mount Vernon St
- 7 Mount Vernon St
- 58 W Friendship St
- 61 Whitmarsh St
- 71 Princeton Ave
- 68 Whitmarsh St
- 9 Hayward St
- 26 Cromwell St
- 462 Prairie Ave
- 176 Reynolds Ave
- 217 Elmwood Ave
- 98 Whitmarsh St
- 729 Potters Ave
- 288 Potters Ave
- 296 Potters Ave
- 407 Pine St Unit 303
- 27 Harvard Ave
- 76 Comstock Ave
- 15 Harvard Ave
- 15 Harvard Ave Unit 1
- 86 Comstock Ave
- 35 Harvard Ave
- 72 Comstock Ave
- 20 Harvard Ave
- 92 Comstock Ave
- 16 Harvard Ave
- 30 Harvard Ave
- 7 Harvard Ave
- 36 Harvard Ave
- 10 Harvard Ave
- 75 Comstock Ave
- 60 Comstock Ave
- 67 Comstock Ave
- 87 Comstock Ave
- 81 Comstock Ave
- 98 Comstock Ave
Your Personal Tour Guide
Ask me questions while you tour the home.