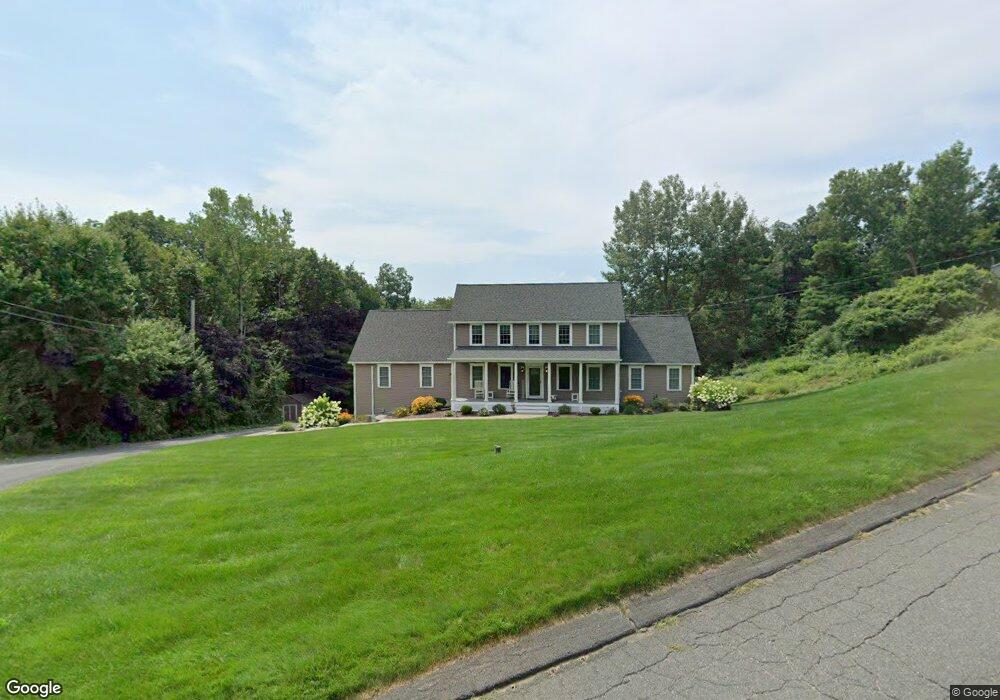
21 Hemlock Hollow Belchertown, MA 01007
Estimated Value: $526,000 - $683,661
3
Beds
4
Baths
3,409
Sq Ft
$184/Sq Ft
Est. Value
About This Home
This home is located at 21 Hemlock Hollow, Belchertown, MA 01007 and is currently estimated at $628,165, approximately $184 per square foot. 21 Hemlock Hollow is a home located in Hampshire County with nearby schools including Chestnut Hill Community School, Swift River Elementary School, and Jabish Middle School.
Ownership History
Date
Name
Owned For
Owner Type
Purchase Details
Closed on
Feb 2, 2005
Sold by
Lepage Jodie and Picano Jodie
Bought by
Lepage Jodie and Lepage Steven
Current Estimated Value
Home Financials for this Owner
Home Financials are based on the most recent Mortgage that was taken out on this home.
Original Mortgage
$260,000
Interest Rate
5.77%
Mortgage Type
Purchase Money Mortgage
Purchase Details
Closed on
Sep 4, 2002
Sold by
Sheridan Dawn M and Sheridan William R
Bought by
Lapage Steve and Picano Jodie
Home Financials for this Owner
Home Financials are based on the most recent Mortgage that was taken out on this home.
Original Mortgage
$215,000
Interest Rate
6.39%
Mortgage Type
Purchase Money Mortgage
Purchase Details
Closed on
Sep 12, 2000
Sold by
Phillips Joseph B
Bought by
Sheridan Dawn M and Sheridan William R
Create a Home Valuation Report for This Property
The Home Valuation Report is an in-depth analysis detailing your home's value as well as a comparison with similar homes in the area
Home Values in the Area
Average Home Value in this Area
Purchase History
| Date | Buyer | Sale Price | Title Company |
|---|---|---|---|
| Lepage Jodie | -- | -- | |
| Lapage Steve | $215,000 | -- | |
| Sheridan Dawn M | $176,500 | -- |
Source: Public Records
Mortgage History
| Date | Status | Borrower | Loan Amount |
|---|---|---|---|
| Open | Sheridan Dawn M | $332,750 | |
| Closed | Sheridan Dawn M | $50,000 | |
| Closed | Sheridan Dawn M | $260,000 | |
| Previous Owner | Sheridan Dawn M | $215,000 |
Source: Public Records
Tax History Compared to Growth
Tax History
| Year | Tax Paid | Tax Assessment Tax Assessment Total Assessment is a certain percentage of the fair market value that is determined by local assessors to be the total taxable value of land and additions on the property. | Land | Improvement |
|---|---|---|---|---|
| 2025 | $9,035 | $622,700 | $91,300 | $531,400 |
| 2024 | $8,650 | $564,600 | $78,800 | $485,800 |
| 2023 | $8,392 | $514,200 | $75,200 | $439,000 |
| 2022 | $8,275 | $468,600 | $75,200 | $393,400 |
| 2021 | $8,073 | $445,300 | $75,200 | $370,100 |
| 2020 | $7,773 | $427,800 | $75,200 | $352,600 |
| 2019 | $7,198 | $392,900 | $77,100 | $315,800 |
| 2018 | $6,568 | $361,100 | $77,100 | $284,000 |
| 2017 | $6,465 | $355,200 | $76,000 | $279,200 |
| 2016 | $6,085 | $338,600 | $71,200 | $267,400 |
| 2015 | $6,072 | $339,400 | $69,300 | $270,100 |
Source: Public Records
Map
Nearby Homes
- 10 Chestnut Dr
- 15 Terry Ln
- 248 Barton Ave
- 8a State St
- 18C Granby Rd
- 255 State St
- 281 Chauncey Walker St Unit 188 AveF
- 281 Chauncey Walker St Unit Lot 37
- 281 Chauncey Walker Unit 548,Ave M
- 92~Lot 2 Chicopee St
- 54 Rural Rd
- 25 Sycamore Cir
- Lot 1 Chicopee St
- 159 School St
- 110 N Washington St
- 45 Howard St
- Lot 2 Chicopee St
- 50 Center St Unit 9
- 399 N Washington St
- 17 Sunny Crest Ln
- 19 Hemlock Hollow
- 14 Hemlock Hollow
- 14 Oakridge Dr
- 20 Hemlock Hollow
- 25 Hemlock Hollow
- 10 Hemlock Hollow
- 57 Oakridge
- 17 Hemlock Hollow
- 84 Oakridge Dr
- 96 Oakridge Dr
- 6 Hemlock Hollow
- 15 Hemlock Hollow
- 98 Oakridge Dr
- 102 Oakridge Dr
- 4 Hemlock Hollow
- 4 Chestnut Dr
- 76 Oakridge Dr
- 71 Oakridge Dr
- 60 Chestnut Dr
- 95 Oakridge Dr