
Seller's Agent in 2025
Case Foster
Realty One Group Next Level
(603) 818-1676
1 in this area
20 Total Sales
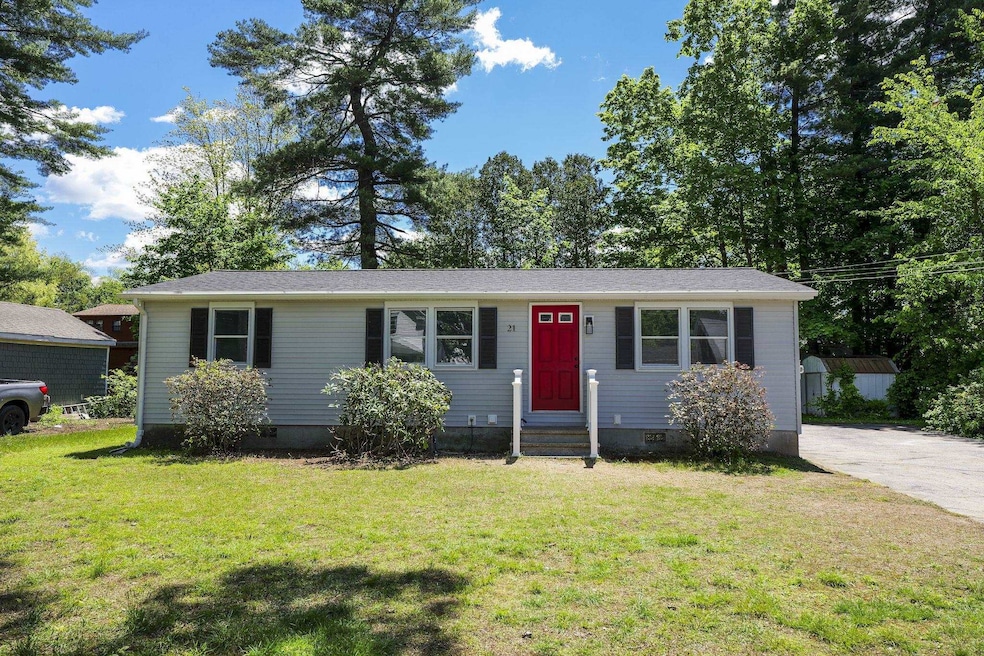
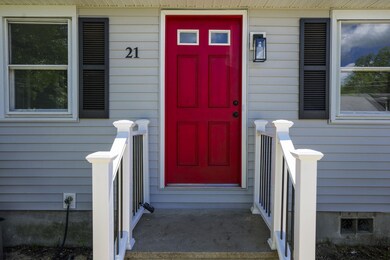
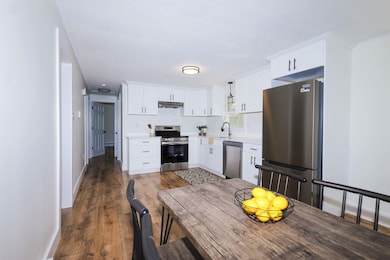
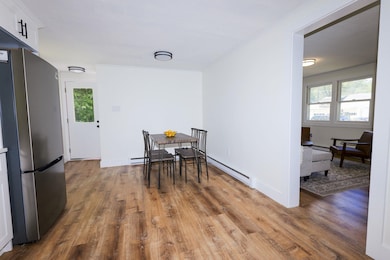
Settle in this newly renovated bright ranch in Concord, NH - just off I-93!
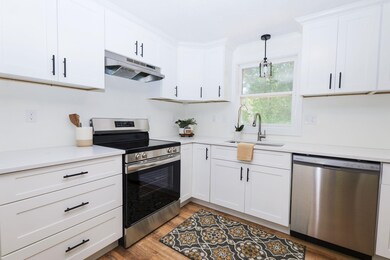
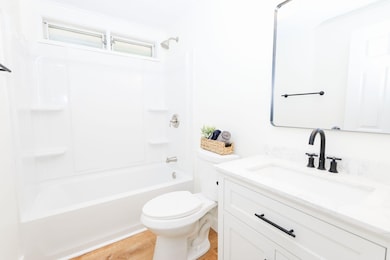
This freshly updated home welcomes you with a beautiful kitchen that features quartz countertops and stainless-steel appliances. The bathroom includes an updated tub/shower, new lighting, vanity, faucet, toilet, and mirror. There’s space for everyone with three bedrooms and a spacious landscaped yard ready for a barbecue or garden. Not to mention, it’s right down the street from Rolland’s Park, a scenic gem, within walking distance. The property also comes with an 80 sq. ft. metal shed that provides ample outdoor storage for all your needs. Enjoy public water, sewer, electric heat, and proximity to schools, shopping, and highways.
NOTE: Open House Saturday and Sunday, 10 AM–12 PM—schedule your tour today!
Last Agent to Sell the Property
Realty One Group Next Level License #078599 Listed on: 05/28/2025
| Date | Type | Sale Price | Title Company |
|---|---|---|---|
| Warranty Deed | $405,533 | -- | |
| Warranty Deed | $405,533 | -- | |
| Warranty Deed | $250,000 | None Available | |
| Warranty Deed | $250,000 | None Available | |
| Warranty Deed | $79,900 | -- | |
| Warranty Deed | $79,900 | -- |
| Date | Status | Loan Amount | Loan Type |
|---|---|---|---|
| Open | $271,685 | New Conventional | |
| Closed | $271,685 | New Conventional | |
| Previous Owner | $313,000 | Purchase Money Mortgage | |
| Previous Owner | $75,900 | Purchase Money Mortgage |
| Date | Event | Price | List to Sale | Price per Sq Ft |
|---|---|---|---|---|
| 07/09/2025 07/09/25 | Sold | $405,500 | +1.4% | $402 / Sq Ft |
| 06/09/2025 06/09/25 | Pending | -- | -- | -- |
| 06/03/2025 06/03/25 | Price Changed | $399,900 | -5.9% | $397 / Sq Ft |
| 05/28/2025 05/28/25 | For Sale | $425,000 | -- | $422 / Sq Ft |
| Year | Tax Paid | Tax Assessment Tax Assessment Total Assessment is a certain percentage of the fair market value that is determined by local assessors to be the total taxable value of land and additions on the property. | Land | Improvement |
|---|---|---|---|---|
| 2024 | $6,560 | $236,900 | $116,800 | $120,100 |
| 2023 | $6,363 | $236,900 | $116,800 | $120,100 |
| 2022 | $6,133 | $236,900 | $116,800 | $120,100 |
| 2021 | $5,886 | $234,300 | $116,800 | $117,500 |
| 2020 | $5,574 | $208,300 | $102,100 | $106,200 |
| 2019 | $5,417 | $195,000 | $102,100 | $92,900 |
| 2018 | $5,386 | $191,100 | $105,500 | $85,600 |
| 2017 | $5,205 | $184,300 | $103,700 | $80,600 |
| 2016 | $4,922 | $177,900 | $103,700 | $74,200 |
| 2015 | $4,754 | $167,000 | $97,300 | $69,700 |
| 2014 | $4,477 | $167,000 | $97,300 | $69,700 |
| 2013 | -- | $164,400 | $97,300 | $67,100 |
| 2012 | -- | $171,700 | $106,400 | $65,300 |
Seller's Agent in 2025
Case Foster
Realty One Group Next Level
(603) 818-1676
1 in this area
20 Total Sales
Buyer's Agent in 2025
Adam Gaudet
603 Birch Realty, LLC
(603) 370-8040
5 in this area
83 Total Sales
Source: PrimeMLS
MLS Number: 5043151
APN: CNCD-000008-000005-000006
Disclaimer: Certain information contained herein is derived from information provided by parties other than Homes.com. All information provided is deemed reliable, but is not guaranteed to be accurate and should be independently verified.
![]() Copyright 2025 PrimeMLS, Inc. All rights reserved. This information is deemed reliable, but not guaranteed. The data relating to real estate displayed on this display comes in part from the IDX Program of PrimeMLS. The information being provided is for consumers’ personal, non-commercial use and may not be used for any purpose other than to identify prospective properties consumers may be interested in purchasing.
Copyright 2025 PrimeMLS, Inc. All rights reserved. This information is deemed reliable, but not guaranteed. The data relating to real estate displayed on this display comes in part from the IDX Program of PrimeMLS. The information being provided is for consumers’ personal, non-commercial use and may not be used for any purpose other than to identify prospective properties consumers may be interested in purchasing.