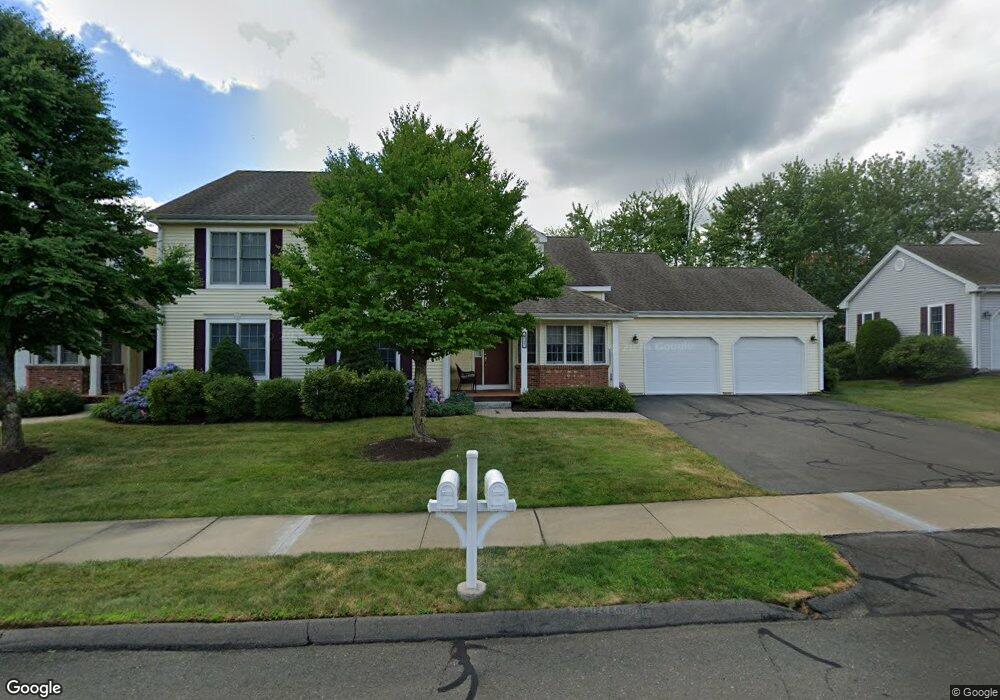
21 Hudson Ln Windsor, CT 06095
West Windsor NeighborhoodEstimated Value: $423,000 - $456,828
4
Beds
3
Baths
2,184
Sq Ft
$203/Sq Ft
Est. Value
About This Home
This home is located at 21 Hudson Ln, Windsor, CT 06095 and is currently estimated at $443,707, approximately $203 per square foot. 21 Hudson Ln is a home located in Hartford County with nearby schools including Oliver Ellsworth School, John F. Kennedy School, and Sage Park Middle School.
Ownership History
Date
Name
Owned For
Owner Type
Purchase Details
Closed on
Mar 26, 2025
Sold by
Delpha Thomas A and Delpha Marlyn
Bought by
Morris Ann M
Current Estimated Value
Home Financials for this Owner
Home Financials are based on the most recent Mortgage that was taken out on this home.
Original Mortgage
$210,000
Outstanding Balance
$208,925
Interest Rate
6.87%
Mortgage Type
Purchase Money Mortgage
Estimated Equity
$234,782
Purchase Details
Closed on
Feb 23, 2018
Sold by
Qin Zhong and Zhang Xi
Bought by
Delpha Thomas A and Delpha Marlyn
Home Financials for this Owner
Home Financials are based on the most recent Mortgage that was taken out on this home.
Original Mortgage
$215,200
Interest Rate
3.99%
Mortgage Type
New Conventional
Purchase Details
Closed on
Sep 11, 2015
Sold by
Qin Zhong and Zhang Xi
Bought by
Qin Zhong and Zhang Xi
Purchase Details
Closed on
May 26, 2005
Sold by
Kramer James
Bought by
Ye Xing and Qin Zhong
Home Financials for this Owner
Home Financials are based on the most recent Mortgage that was taken out on this home.
Original Mortgage
$268,000
Interest Rate
4.95%
Mortgage Type
Purchase Money Mortgage
Create a Home Valuation Report for This Property
The Home Valuation Report is an in-depth analysis detailing your home's value as well as a comparison with similar homes in the area
Home Values in the Area
Average Home Value in this Area
Purchase History
| Date | Buyer | Sale Price | Title Company |
|---|---|---|---|
| Morris Ann M | $420,000 | None Available | |
| Morris Ann M | $420,000 | None Available | |
| Delpha Thomas A | $269,000 | -- | |
| Delpha Thomas A | $269,000 | -- | |
| Qin Zhong | -- | -- | |
| Qin Zhong | -- | -- | |
| Ye Xing | $335,000 | -- | |
| Ye Xing | $335,000 | -- |
Source: Public Records
Mortgage History
| Date | Status | Borrower | Loan Amount |
|---|---|---|---|
| Open | Morris Ann M | $210,000 | |
| Closed | Morris Ann M | $210,000 | |
| Previous Owner | Ye Xing | $215,200 | |
| Previous Owner | Ye Xing | $268,000 |
Source: Public Records
Tax History Compared to Growth
Tax History
| Year | Tax Paid | Tax Assessment Tax Assessment Total Assessment is a certain percentage of the fair market value that is determined by local assessors to be the total taxable value of land and additions on the property. | Land | Improvement |
|---|---|---|---|---|
| 2025 | $7,144 | $251,090 | $0 | $251,090 |
| 2024 | $7,613 | $251,090 | $0 | $251,090 |
| 2023 | $5,991 | $178,290 | $0 | $178,290 |
| 2022 | $5,932 | $178,290 | $0 | $178,290 |
| 2021 | $5,932 | $178,290 | $0 | $178,290 |
| 2020 | $5,903 | $178,290 | $0 | $178,290 |
| 2019 | $5,773 | $178,290 | $0 | $178,290 |
| 2018 | $5,973 | $181,230 | $0 | $181,230 |
| 2017 | $5,881 | $181,230 | $0 | $181,230 |
| 2016 | $5,712 | $181,230 | $0 | $181,230 |
| 2015 | $5,604 | $181,230 | $0 | $181,230 |
| 2014 | $5,522 | $181,230 | $0 | $181,230 |
Source: Public Records
Map
Nearby Homes
- 5 Hudson Ln Unit 5
- 887 Poquonock Ave
- 490 Old Day Hill Rd
- 1999 Poquonock Ave
- 9 Milo Peck Ln
- 307 Trapper Cir
- 22 Eastview Dr
- 400 Old Day Hill Rd
- 23 Griswold Dr
- 1 Deanne Lynn Cir
- 268 High Path Rd Unit 268
- 17 Box Turtle Ln
- 375 Dunfey Ln
- 418 Pond Bridge Rd
- 501 Kennedy Rd
- 142 High Path Rd
- 319 Dunfey Ln Unit 319
- 114 High Path Rd Unit 114
- 98 High Path Rd
- 94 Clubhouse Rd