21 Hussey Ave Danvers, MA 01923
Estimated Value: $618,702 - $726,000
3
Beds
1
Bath
1,537
Sq Ft
$439/Sq Ft
Est. Value
About This Home
This home is located at 21 Hussey Ave, Danvers, MA 01923 and is currently estimated at $674,426, approximately $438 per square foot. 21 Hussey Ave is a home located in Essex County with nearby schools including Danvers High School, The Saints Academy, and Mrs Alexander's School.
Ownership History
Date
Name
Owned For
Owner Type
Purchase Details
Closed on
Apr 12, 2017
Sold by
Klibansky Stephen J and Sargent Cynthia A
Bought by
Sargent Cindy A
Current Estimated Value
Home Financials for this Owner
Home Financials are based on the most recent Mortgage that was taken out on this home.
Original Mortgage
$288,000
Outstanding Balance
$237,782
Interest Rate
4.1%
Mortgage Type
New Conventional
Estimated Equity
$436,644
Purchase Details
Closed on
Sep 23, 1991
Sold by
Adams Robert M and Adams Cynthia
Bought by
Klibansky Stephen J and Sargent Cynthia
Create a Home Valuation Report for This Property
The Home Valuation Report is an in-depth analysis detailing your home's value as well as a comparison with similar homes in the area
Home Values in the Area
Average Home Value in this Area
Purchase History
| Date | Buyer | Sale Price | Title Company |
|---|---|---|---|
| Sargent Cindy A | -- | -- | |
| Klibansky Stephen J | $141,000 | -- |
Source: Public Records
Mortgage History
| Date | Status | Borrower | Loan Amount |
|---|---|---|---|
| Open | Sargent Cindy A | $288,000 | |
| Previous Owner | Klibansky Stephen J | $210,000 | |
| Previous Owner | Klibansky Stephen J | $240,000 | |
| Previous Owner | Klibansky Stephen J | $190,000 |
Source: Public Records
Tax History
| Year | Tax Paid | Tax Assessment Tax Assessment Total Assessment is a certain percentage of the fair market value that is determined by local assessors to be the total taxable value of land and additions on the property. | Land | Improvement |
|---|---|---|---|---|
| 2025 | $6,437 | $585,700 | $369,900 | $215,800 |
| 2024 | $6,407 | $576,700 | $369,900 | $206,800 |
| 2023 | $6,208 | $528,300 | $336,100 | $192,200 |
| 2022 | $6,105 | $482,200 | $305,000 | $177,200 |
| 2021 | $5,947 | $445,500 | $288,900 | $156,600 |
| 2020 | $5,774 | $442,100 | $285,500 | $156,600 |
| 2019 | $5,583 | $420,400 | $259,600 | $160,800 |
| 2018 | $5,384 | $397,600 | $257,000 | $140,600 |
| 2017 | $5,103 | $359,600 | $224,500 | $135,100 |
| 2016 | $4,883 | $343,900 | $214,100 | $129,800 |
| 2015 | $4,716 | $316,300 | $194,700 | $121,600 |
Source: Public Records
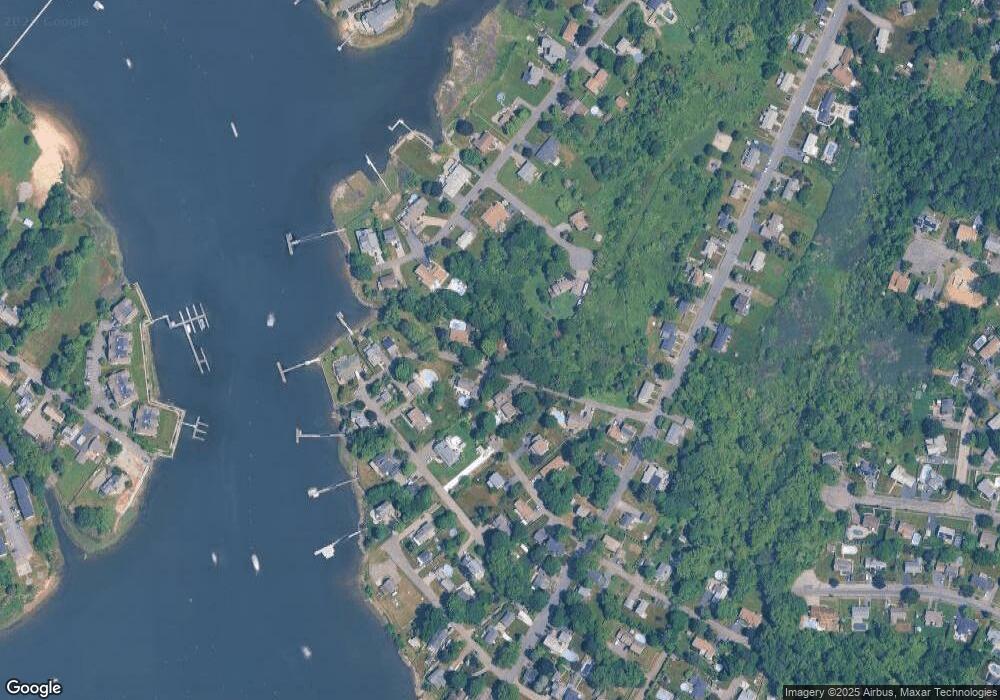
Map
Nearby Homes
- 59 Riverview Ave
- 6 Mcdewell Ave Unit 4
- 13 Giles Ave Unit 2
- 147 High St
- 44 Foster St
- 9 Parkview Ave
- 125 Livingstone Ave
- 123 Livingstone Ave
- 15 Roland Rd
- 108 Abington Rd Unit 108
- 6 Grant St
- 11 Evans Rd
- 4 Duck Pond Rd Unit 225
- 6 Pilgrim Heights
- 48 Margin St
- 61 High St
- 6 Abington Ave
- 152 Endicott St
- 14 Chase St
- 35 High St Unit 3D
- 11 Hussey Ave
- 10 Hussey Ave
- 12 Hussey Ave
- 5 Jalbert Ln
- 4 Chevalier Ave
- 46 Riverview Ave
- 2 Kimball Ave
- 14 Hussey Ave
- 7 Hussey Ave
- 44 Riverview Ave
- 48 Riverview Ave
- 8 Chevalier Ave
- 5 Hussey Ave
- 38 Riverview Ave
- 4 Kimball Ave
- 1 Kimball Ave
- 4 Jalbert Ln
- 71 Bradstreet Ave
- 75 Bradstreet Ave
- 33 Bradstreet Ave
Your Personal Tour Guide
Ask me questions while you tour the home.