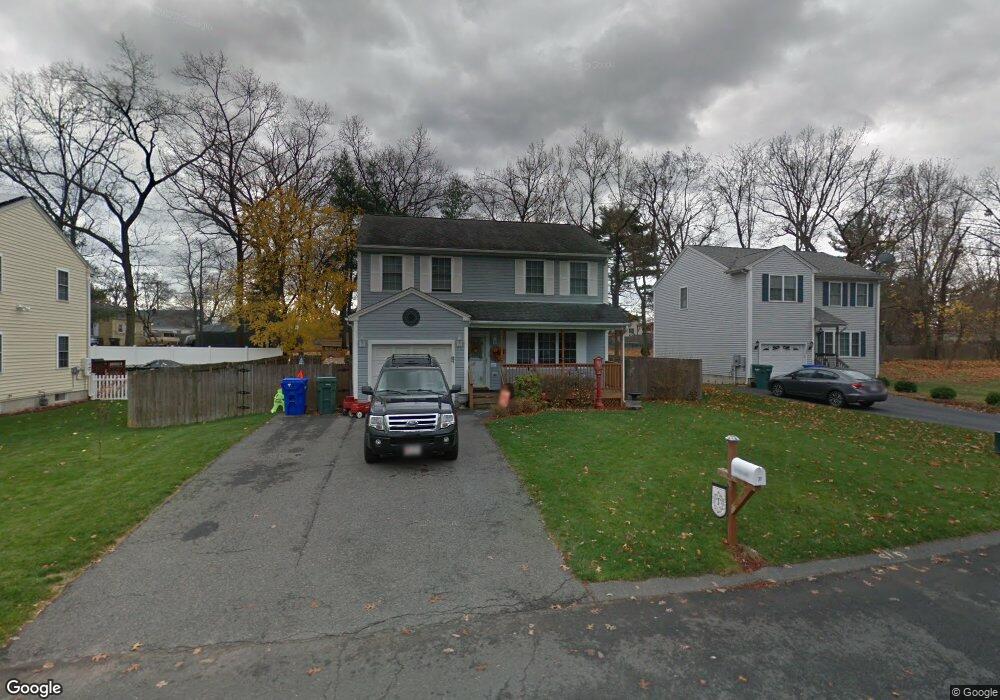
21 Jimmy Ct Springfield, MA 01104
East Springfield NeighborhoodEstimated Value: $325,513 - $402,000
3
Beds
2
Baths
1,432
Sq Ft
$250/Sq Ft
Est. Value
About This Home
This home is located at 21 Jimmy Ct, Springfield, MA 01104 and is currently estimated at $358,128, approximately $250 per square foot. 21 Jimmy Ct is a home located in Hampden County with nearby schools including Daniel B Brunton, John F. Kennedy Academy, and Springfield Central High School.
Ownership History
Date
Name
Owned For
Owner Type
Purchase Details
Closed on
Apr 13, 2007
Sold by
Stark Amanda L
Bought by
Tetreault Robert and Stark Amanda L
Current Estimated Value
Home Financials for this Owner
Home Financials are based on the most recent Mortgage that was taken out on this home.
Original Mortgage
$204,250
Interest Rate
6.24%
Mortgage Type
Purchase Money Mortgage
Purchase Details
Closed on
Feb 2, 2005
Sold by
Bermi Dev Inc
Bought by
Stark Amanda L
Home Financials for this Owner
Home Financials are based on the most recent Mortgage that was taken out on this home.
Original Mortgage
$152,720
Interest Rate
5.77%
Mortgage Type
Purchase Money Mortgage
Create a Home Valuation Report for This Property
The Home Valuation Report is an in-depth analysis detailing your home's value as well as a comparison with similar homes in the area
Home Values in the Area
Average Home Value in this Area
Purchase History
| Date | Buyer | Sale Price | Title Company |
|---|---|---|---|
| Tetreault Robert | -- | -- | |
| Stark Amanda L | $190,900 | -- |
Source: Public Records
Mortgage History
| Date | Status | Borrower | Loan Amount |
|---|---|---|---|
| Open | Stark Amanda L | $196,975 | |
| Closed | Tetreault Robert | $204,250 | |
| Previous Owner | Stark Amanda L | $152,720 |
Source: Public Records
Tax History
| Year | Tax Paid | Tax Assessment Tax Assessment Total Assessment is a certain percentage of the fair market value that is determined by local assessors to be the total taxable value of land and additions on the property. | Land | Improvement |
|---|---|---|---|---|
| 2025 | $4,889 | $311,800 | $39,000 | $272,800 |
| 2024 | $4,779 | $297,600 | $39,000 | $258,600 |
| 2023 | $4,638 | $272,000 | $36,300 | $235,700 |
| 2022 | $4,536 | $241,000 | $34,000 | $207,000 |
| 2021 | $4,198 | $222,100 | $30,900 | $191,200 |
| 2020 | $4,119 | $210,900 | $30,900 | $180,000 |
| 2019 | $3,977 | $202,100 | $31,900 | $170,200 |
| 2018 | $3,964 | $201,400 | $31,900 | $169,500 |
| 2017 | $3,796 | $193,100 | $28,900 | $164,200 |
| 2016 | $3,728 | $189,600 | $28,900 | $160,700 |
| 2015 | $3,568 | $181,400 | $28,900 | $152,500 |
Source: Public Records
Map
Nearby Homes
- 294 Tremont St
- 83 Oakdale St
- 93 Grochmal Ave Unit 12
- 19 Emily St
- 4 Seneca St
- 57 Davenport St
- 147 Bowles Park
- 66 Bromont St
- 28 Mockingbird Dr
- 108 Barre St
- 1289 Bay St
- 1277 Bay St
- 251 Edendale St
- 225 Osborne Terrace
- 181 Marsden St
- 543 Boston Rd
- 58 Eureka St
- 54 Old Fuller rd Extension
- 63 Peer St
- 270 Berkshire Ave
Your Personal Tour Guide
Ask me questions while you tour the home.