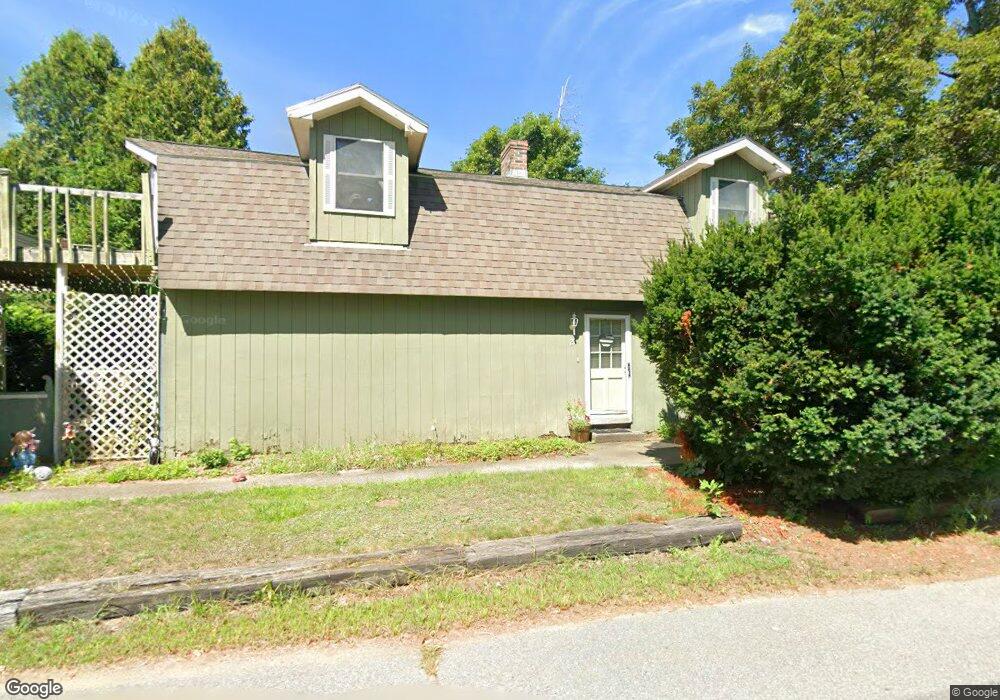
21 Joslin Rd Winchendon, MA 01475
Estimated Value: $386,775 - $441,000
2
Beds
2
Baths
1,802
Sq Ft
$230/Sq Ft
Est. Value
About This Home
This home is located at 21 Joslin Rd, Winchendon, MA 01475 and is currently estimated at $414,194, approximately $229 per square foot. 21 Joslin Rd is a home located in Worcester County with nearby schools including Toy Town Elementary School, Memorial, and The Winchendon School.
Ownership History
Date
Name
Owned For
Owner Type
Purchase Details
Closed on
Aug 2, 1993
Sold by
Lambert Glenn B and Lambert Kathleen
Bought by
Contois Steven D and Contois Debora
Current Estimated Value
Home Financials for this Owner
Home Financials are based on the most recent Mortgage that was taken out on this home.
Original Mortgage
$100,500
Interest Rate
7.32%
Mortgage Type
Purchase Money Mortgage
Create a Home Valuation Report for This Property
The Home Valuation Report is an in-depth analysis detailing your home's value as well as a comparison with similar homes in the area
Home Values in the Area
Average Home Value in this Area
Purchase History
| Date | Buyer | Sale Price | Title Company |
|---|---|---|---|
| Contois Steven D | $100,000 | -- | |
| Contois Steven D | $100,000 | -- |
Source: Public Records
Mortgage History
| Date | Status | Borrower | Loan Amount |
|---|---|---|---|
| Open | Contois Steven D | $91,000 | |
| Closed | Contois Steven D | $100,500 |
Source: Public Records
Tax History Compared to Growth
Tax History
| Year | Tax Paid | Tax Assessment Tax Assessment Total Assessment is a certain percentage of the fair market value that is determined by local assessors to be the total taxable value of land and additions on the property. | Land | Improvement |
|---|---|---|---|---|
| 2025 | $3,294 | $280,300 | $50,500 | $229,800 |
| 2024 | $3,273 | $261,000 | $46,200 | $214,800 |
| 2023 | $3,236 | $241,500 | $44,000 | $197,500 |
| 2022 | $3,492 | $231,100 | $55,200 | $175,900 |
| 2021 | $6,700 | $201,100 | $48,700 | $152,400 |
| 2020 | $3,046 | $187,100 | $46,500 | $140,600 |
| 2019 | $2,954 | $176,800 | $43,500 | $133,300 |
| 2018 | $5,462 | $167,300 | $40,400 | $126,900 |
| 2017 | $2,866 | $159,500 | $38,500 | $121,000 |
| 2016 | $2,672 | $153,300 | $36,700 | $116,600 |
| 2015 | $2,490 | $148,900 | $36,700 | $112,200 |
| 2014 | $2,338 | $146,500 | $38,700 | $107,800 |
Source: Public Records
Map
Nearby Homes
- 371 Hitchcock Rd
- 369 Hitchcock Rd
- 49 Doyle Ave
- 47-LT 244 Doyle Ave
- 405 Hale St
- Lot B1&B2 Baldwinville Rd
- 1135 Alger St
- Lot 14 Baldwinville State Rd
- 64 Baldwinville State Rd
- 330 Benjamin St
- 27 Cottage St
- 21 Cottage St
- 67 Hill St
- 21 Sibley Rd
- 32 Ash St
- 49 Kemp St
- 69 Kemp St
- 19 Chestnut St
- 59 Kemp St
- 34 West St