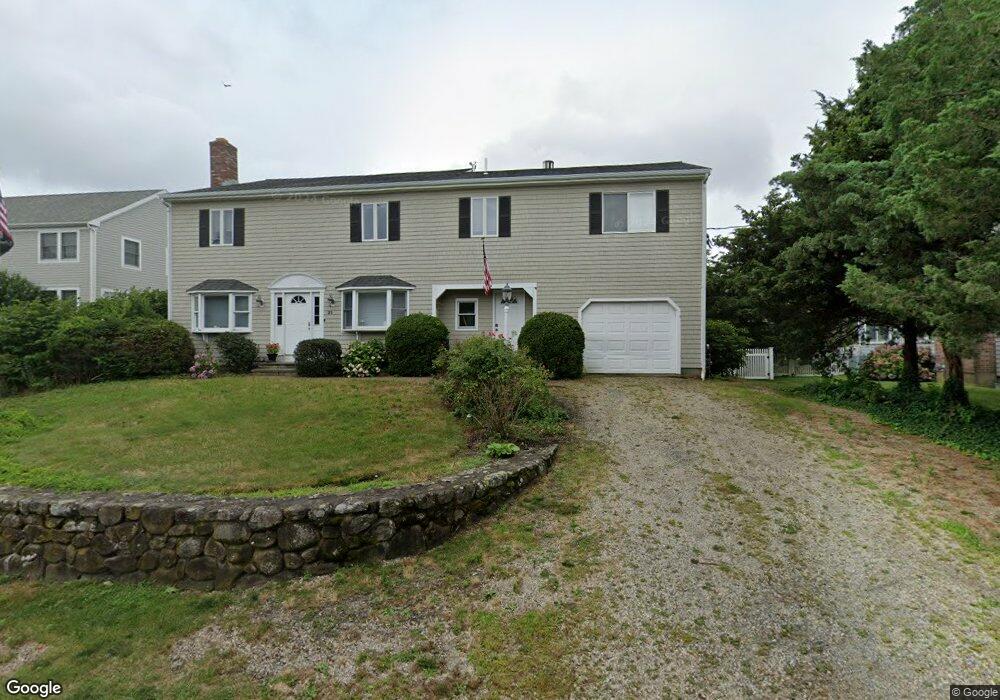
21 Kenwood Rd Pocasset, MA 02559
Pocasset NeighborhoodEstimated Value: $816,000 - $1,084,000
4
Beds
3
Baths
2,701
Sq Ft
$347/Sq Ft
Est. Value
About This Home
This home is located at 21 Kenwood Rd, Pocasset, MA 02559 and is currently estimated at $937,900, approximately $347 per square foot. 21 Kenwood Rd is a home located in Barnstable County with nearby schools including Bourne High School and Cadence Academy Preschool - Bourne.
Ownership History
Date
Name
Owned For
Owner Type
Purchase Details
Closed on
Dec 9, 2014
Sold by
Mondou Maureen H
Bought by
Mondou Ft and Mondou
Current Estimated Value
Purchase Details
Closed on
Nov 4, 1999
Sold by
Cintolo Michael A
Bought by
Vey Jennifer A and Vendice Nancy P
Purchase Details
Closed on
Oct 15, 1987
Sold by
Oneill Gerard M
Bought by
Cintolo Michael A
Create a Home Valuation Report for This Property
The Home Valuation Report is an in-depth analysis detailing your home's value as well as a comparison with similar homes in the area
Home Values in the Area
Average Home Value in this Area
Purchase History
| Date | Buyer | Sale Price | Title Company |
|---|---|---|---|
| Mondou Ft | -- | -- | |
| Mondou Ft | -- | -- | |
| Vey Jennifer A | $285,000 | -- | |
| Vey Jennifer A | $285,000 | -- | |
| Cintolo Michael A | $150,000 | -- |
Source: Public Records
Mortgage History
| Date | Status | Borrower | Loan Amount |
|---|---|---|---|
| Previous Owner | Cintolo Michael A | $220,000 | |
| Previous Owner | Cintolo Michael A | $222,900 | |
| Previous Owner | Cintolo Michael A | $224,300 |
Source: Public Records
Tax History Compared to Growth
Tax History
| Year | Tax Paid | Tax Assessment Tax Assessment Total Assessment is a certain percentage of the fair market value that is determined by local assessors to be the total taxable value of land and additions on the property. | Land | Improvement |
|---|---|---|---|---|
| 2025 | $5,810 | $743,900 | $284,500 | $459,400 |
| 2024 | $5,681 | $708,400 | $270,900 | $437,500 |
| 2023 | $5,523 | $626,900 | $239,800 | $387,100 |
| 2022 | $4,954 | $491,000 | $192,300 | $298,700 |
| 2021 | $4,813 | $446,900 | $175,000 | $271,900 |
| 2020 | $4,684 | $436,100 | $173,300 | $262,800 |
| 2019 | $4,427 | $421,200 | $173,300 | $247,900 |
| 2018 | $4,230 | $401,300 | $165,100 | $236,200 |
| 2017 | $4,092 | $397,300 | $163,500 | $233,800 |
| 2016 | $3,951 | $388,900 | $163,500 | $225,400 |
| 2015 | $3,916 | $388,900 | $163,500 | $225,400 |
Source: Public Records
Map
Nearby Homes