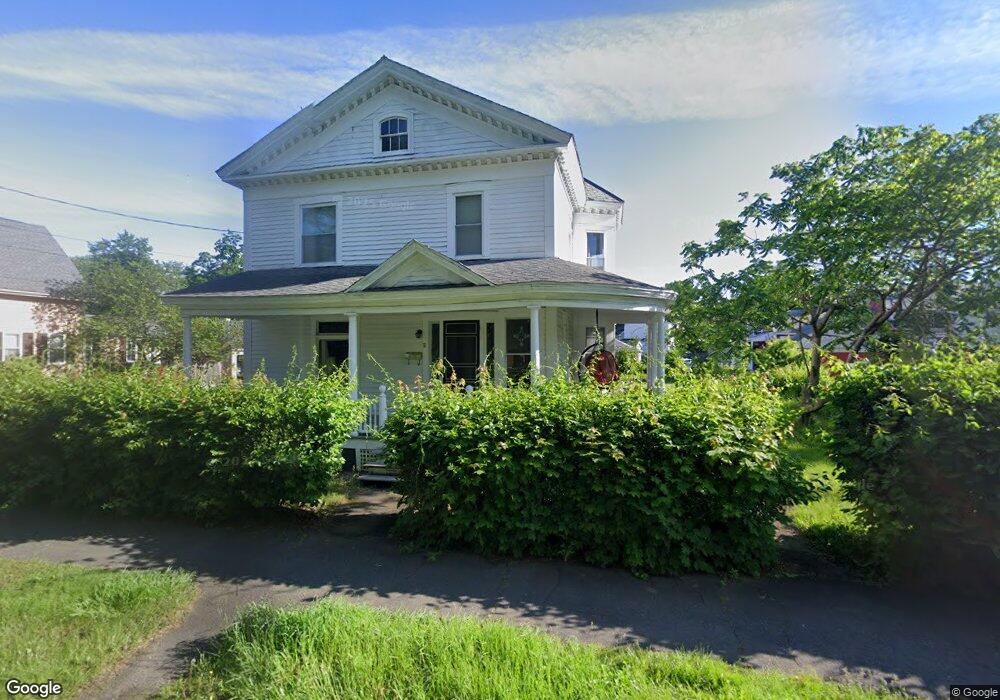
21 King St Westfield, MA 01085
Estimated Value: $286,557 - $380,000
5
Beds
2
Baths
2,767
Sq Ft
$118/Sq Ft
Est. Value
About This Home
This home is located at 21 King St, Westfield, MA 01085 and is currently estimated at $325,639, approximately $117 per square foot. 21 King St is a home located in Hampden County with nearby schools including Westfield High School and Saint Mary High School.
Ownership History
Date
Name
Owned For
Owner Type
Purchase Details
Closed on
May 2, 2022
Sold by
Rodriguez Edwin and Rodriguez Lori J
Bought by
Morse Gabrielle
Current Estimated Value
Home Financials for this Owner
Home Financials are based on the most recent Mortgage that was taken out on this home.
Original Mortgage
$190,000
Outstanding Balance
$176,445
Interest Rate
4.16%
Mortgage Type
Purchase Money Mortgage
Estimated Equity
$149,194
Purchase Details
Closed on
Aug 2, 1994
Sold by
Dewey Robert and Dewey David D
Bought by
Rodriguez Edwin and Rodriguez Lori J
Home Financials for this Owner
Home Financials are based on the most recent Mortgage that was taken out on this home.
Original Mortgage
$80,750
Interest Rate
8.25%
Mortgage Type
Purchase Money Mortgage
Create a Home Valuation Report for This Property
The Home Valuation Report is an in-depth analysis detailing your home's value as well as a comparison with similar homes in the area
Home Values in the Area
Average Home Value in this Area
Purchase History
| Date | Buyer | Sale Price | Title Company |
|---|---|---|---|
| Morse Gabrielle | $201,000 | None Available | |
| Rodriguez Edwin | $85,000 | -- |
Source: Public Records
Mortgage History
| Date | Status | Borrower | Loan Amount |
|---|---|---|---|
| Open | Morse Gabrielle | $190,000 | |
| Previous Owner | Rodriguez Edwin | $100,800 | |
| Previous Owner | Rodriguez Edwin | $94,500 | |
| Previous Owner | Rodriguez Edwin | $80,750 |
Source: Public Records
Tax History
| Year | Tax Paid | Tax Assessment Tax Assessment Total Assessment is a certain percentage of the fair market value that is determined by local assessors to be the total taxable value of land and additions on the property. | Land | Improvement |
|---|---|---|---|---|
| 2025 | $3,768 | $248,200 | $77,500 | $170,700 |
| 2024 | $3,632 | $227,400 | $70,600 | $156,800 |
| 2023 | $46 | $285,100 | $67,200 | $217,900 |
| 2022 | $4,610 | $249,300 | $59,900 | $189,400 |
| 2021 | $2,139 | $236,400 | $56,500 | $179,900 |
| 2020 | $4,277 | $222,200 | $56,500 | $165,700 |
| 2019 | $4,176 | $212,300 | $53,800 | $158,500 |
| 2018 | $3,651 | $188,600 | $53,800 | $134,800 |
| 2017 | $3,585 | $184,600 | $54,600 | $130,000 |
| 2016 | $3,610 | $185,700 | $54,600 | $131,100 |
| 2015 | $3,443 | $185,700 | $54,600 | $131,100 |
| 2014 | $2,573 | $185,700 | $54,600 | $131,100 |
Source: Public Records
Map
Nearby Homes
Your Personal Tour Guide
Ask me questions while you tour the home.