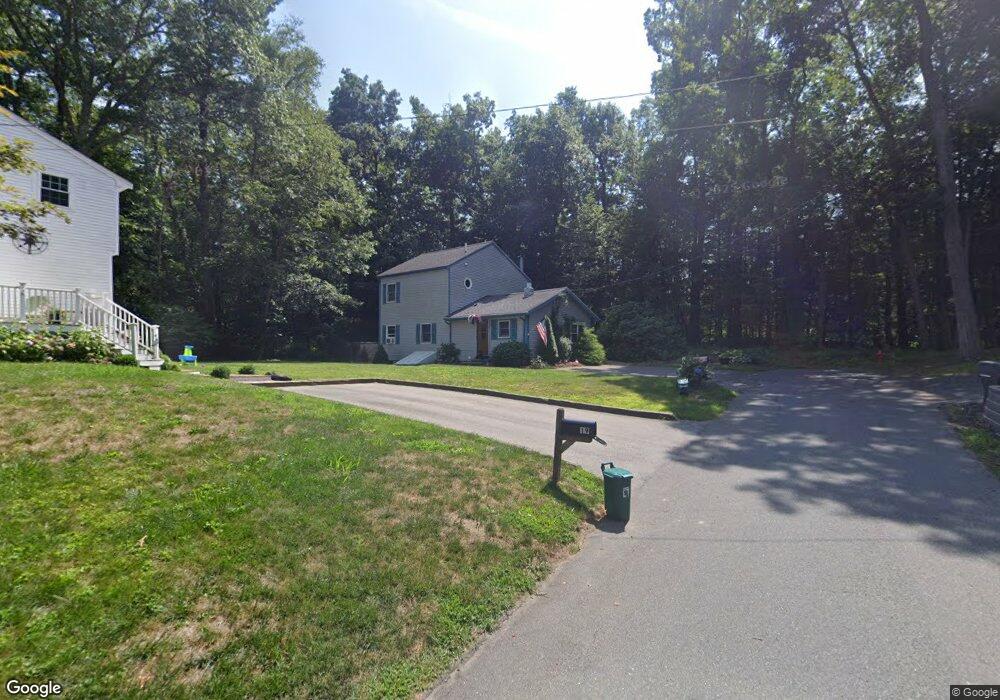
21 Leigh Rd Wenham, MA 01984
Estimated Value: $661,000 - $713,000
2
Beds
2
Baths
1,510
Sq Ft
$454/Sq Ft
Est. Value
About This Home
This home is located at 21 Leigh Rd, Wenham, MA 01984 and is currently estimated at $685,242, approximately $453 per square foot. 21 Leigh Rd is a home located in Essex County with nearby schools including Winthrop School, Cutler Elementary School, and Miles River Middle School.
Ownership History
Date
Name
Owned For
Owner Type
Purchase Details
Closed on
Jun 1, 2009
Sold by
Jackson Jill J
Bought by
Sucharski Evan B
Current Estimated Value
Purchase Details
Closed on
Jun 17, 1999
Sold by
Spears Michael W and Spears Lisa L
Bought by
Jackson Jill J
Create a Home Valuation Report for This Property
The Home Valuation Report is an in-depth analysis detailing your home's value as well as a comparison with similar homes in the area
Home Values in the Area
Average Home Value in this Area
Purchase History
| Date | Buyer | Sale Price | Title Company |
|---|---|---|---|
| Sucharski Evan B | $297,000 | -- | |
| Sucharski Evan B | $297,000 | -- | |
| Jackson Jill J | $130,000 | -- | |
| Jackson Jill J | $130,000 | -- |
Source: Public Records
Mortgage History
| Date | Status | Borrower | Loan Amount |
|---|---|---|---|
| Open | Jackson Jill J | $277,000 | |
| Closed | Jackson Jill J | $284,900 |
Source: Public Records
Tax History Compared to Growth
Tax History
| Year | Tax Paid | Tax Assessment Tax Assessment Total Assessment is a certain percentage of the fair market value that is determined by local assessors to be the total taxable value of land and additions on the property. | Land | Improvement |
|---|---|---|---|---|
| 2025 | $8,236 | $530,000 | $266,400 | $263,600 |
| 2024 | $8,021 | $512,200 | $266,400 | $245,800 |
| 2023 | $6,544 | $377,200 | $188,200 | $189,000 |
| 2022 | $7,388 | $377,300 | $188,200 | $189,100 |
| 2021 | $7,148 | $363,200 | $174,100 | $189,100 |
| 2020 | $6,428 | $339,400 | $168,700 | $170,700 |
| 2019 | $6,116 | $339,400 | $168,700 | $170,700 |
| 2018 | $5,404 | $287,600 | $152,400 | $135,200 |
| 2017 | $5,272 | $287,600 | $152,400 | $135,200 |
| 2016 | $4,883 | $287,600 | $152,400 | $135,200 |
| 2015 | $4,674 | $287,600 | $152,400 | $135,200 |
Source: Public Records
Map
Nearby Homes