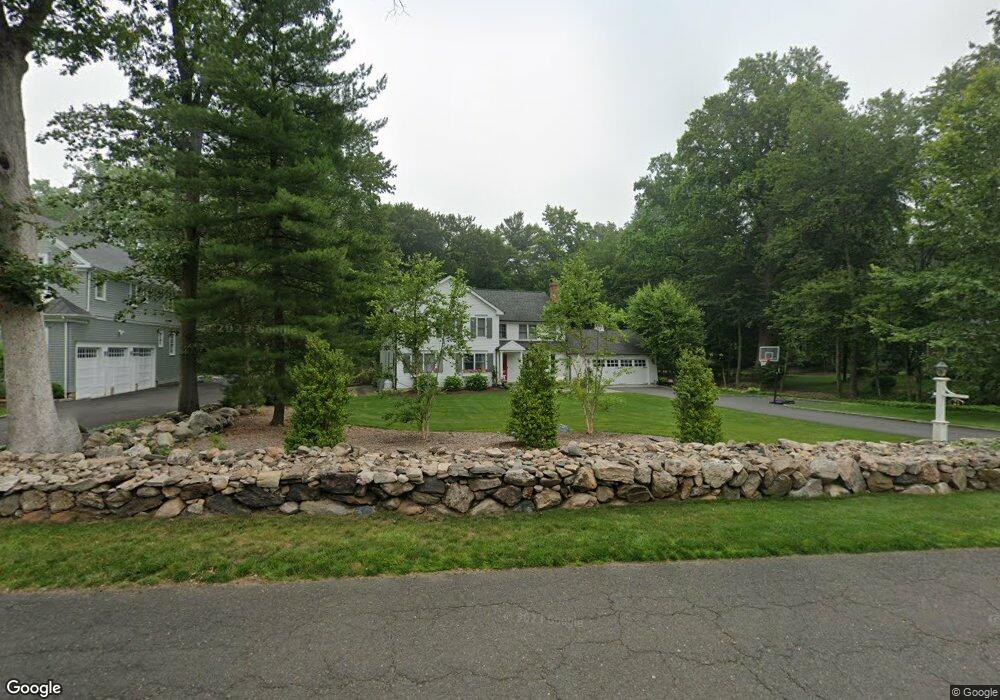
21 Libby Ln Darien, CT 06820
Estimated Value: $2,984,094 - $3,481,000
5
Beds
4
Baths
3,628
Sq Ft
$889/Sq Ft
Est. Value
About This Home
This home is located at 21 Libby Ln, Darien, CT 06820 and is currently estimated at $3,227,024, approximately $889 per square foot. 21 Libby Ln is a home located in Fairfield County with nearby schools including Royle Elementary School, Middlesex Middle School, and Darien High School.
Ownership History
Date
Name
Owned For
Owner Type
Purchase Details
Closed on
Aug 4, 2009
Sold by
Murphy Bryan P and Murphy Sara L
Bought by
Dibenedetto Mark A and Dibenedetto Amy P
Current Estimated Value
Purchase Details
Closed on
Aug 22, 2003
Sold by
Debow Thomas J and Debow Suzanne M
Bought by
Murphy Bryan P and Murphy Sara L
Purchase Details
Closed on
May 10, 2001
Sold by
Douglas Gerald
Bought by
Debow Thomas J and Debow Suzanne M
Purchase Details
Closed on
Jul 16, 1993
Sold by
Arturi Perrin and Voll Arturi Susan
Bought by
Douglas Garald
Purchase Details
Closed on
Jun 15, 1990
Sold by
Evans William
Bought by
Arturi Perrin
Purchase Details
Closed on
Jun 1, 1987
Sold by
Walles James
Bought by
Evans William
Create a Home Valuation Report for This Property
The Home Valuation Report is an in-depth analysis detailing your home's value as well as a comparison with similar homes in the area
Home Values in the Area
Average Home Value in this Area
Purchase History
| Date | Buyer | Sale Price | Title Company |
|---|---|---|---|
| Dibenedetto Mark A | $1,795,000 | -- | |
| Murphy Bryan P | $1,249,000 | -- | |
| Debow Thomas J | $1,000,000 | -- | |
| Douglas Garald | $620,000 | -- | |
| Arturi Perrin | $455,000 | -- | |
| Evans William | $436,000 | -- |
Source: Public Records
Mortgage History
| Date | Status | Borrower | Loan Amount |
|---|---|---|---|
| Open | Evans William | $1,000,000 | |
| Closed | Evans William | $1,225,000 |
Source: Public Records
Tax History Compared to Growth
Tax History
| Year | Tax Paid | Tax Assessment Tax Assessment Total Assessment is a certain percentage of the fair market value that is determined by local assessors to be the total taxable value of land and additions on the property. | Land | Improvement |
|---|---|---|---|---|
| 2025 | $22,667 | $1,464,260 | $953,330 | $510,930 |
| 2024 | $21,510 | $1,464,260 | $953,330 | $510,930 |
| 2023 | $19,123 | $1,085,910 | $612,850 | $473,060 |
| 2022 | $18,710 | $1,085,910 | $612,850 | $473,060 |
| 2021 | $18,287 | $1,085,910 | $612,850 | $473,060 |
| 2020 | $17,765 | $1,085,910 | $612,850 | $473,060 |
| 2019 | $17,885 | $1,085,910 | $612,850 | $473,060 |
| 2018 | $17,595 | $1,094,240 | $616,490 | $477,750 |
| 2017 | $17,683 | $1,094,240 | $616,490 | $477,750 |
| 2016 | $17,256 | $1,094,240 | $616,490 | $477,750 |
| 2015 | $16,797 | $1,094,240 | $616,490 | $477,750 |
| 2014 | $16,425 | $1,094,240 | $616,490 | $477,750 |
Source: Public Records
Map
Nearby Homes
- 223 Middlesex Rd
- 5 Shields Ln
- 10 Stony Brook Rd
- 76 Deepwood Rd
- 166 Hollow Tree Ridge Rd
- 13 Patton Dr
- 17 Sunnyside Ave
- 77 Maple St
- 19 Georgian Ln
- 32 Relihan Rd
- 20 Locust Hill Rd
- 100 Maple Tree Ave Unit 7
- 22 Radio Place Unit 10
- 561 Middlesex Rd
- 17 Pine Brook Ln Unit 17
- 69 Maple Tree Ave Unit 2
- 7 Barnstable Ln
- 910 Hope St Unit 5B
- 85 Camp Ave Unit 10I
- 34 Crescent St Unit 2D