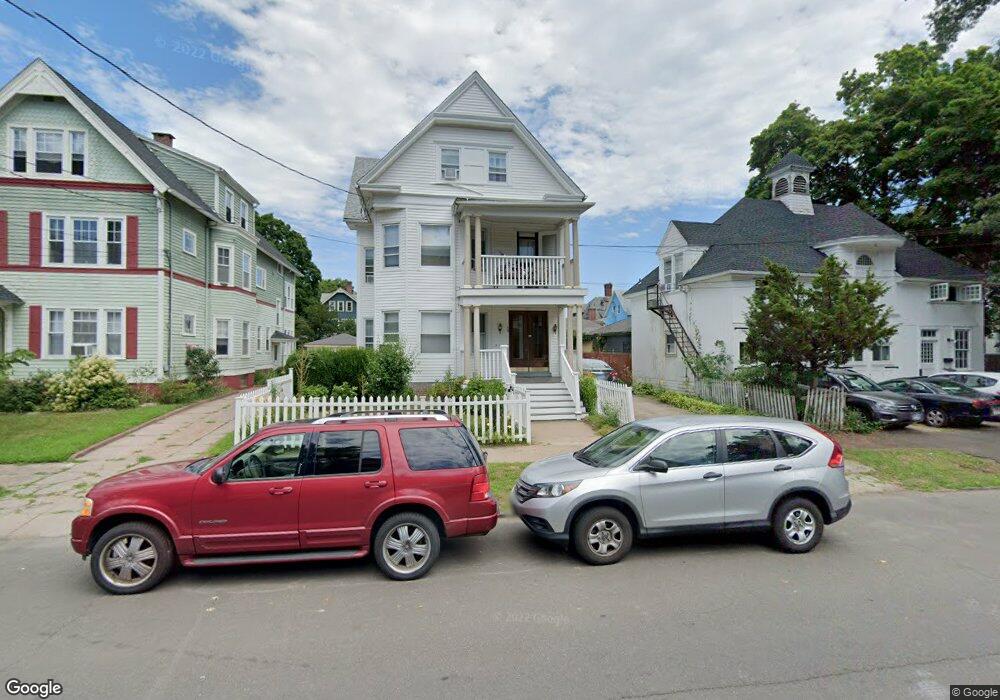
21 Maple St New Haven, CT 06511
Edgewood NeighborhoodEstimated Value: $505,000 - $758,582
5
Beds
3
Baths
3,435
Sq Ft
$170/Sq Ft
Est. Value
About This Home
This home is located at 21 Maple St, New Haven, CT 06511 and is currently estimated at $584,146, approximately $170 per square foot. 21 Maple St is a home located in New Haven County with nearby schools including Edgewood Creative Thinking through STEAM Magnet School, Amistad Academy, and Yeshiva Gedolah Rabbinical Inst.
Ownership History
Date
Name
Owned For
Owner Type
Purchase Details
Closed on
Nov 8, 2013
Sold by
Benitez Delia I and Benitez Elizier
Bought by
Ortiz-Deorue Laura
Current Estimated Value
Purchase Details
Closed on
Jun 4, 1991
Sold by
Platt Helen F
Bought by
Danna Dean P and Danna Tracy M
Home Financials for this Owner
Home Financials are based on the most recent Mortgage that was taken out on this home.
Original Mortgage
$144,000
Interest Rate
9.35%
Mortgage Type
Unknown
Create a Home Valuation Report for This Property
The Home Valuation Report is an in-depth analysis detailing your home's value as well as a comparison with similar homes in the area
Home Values in the Area
Average Home Value in this Area
Purchase History
| Date | Buyer | Sale Price | Title Company |
|---|---|---|---|
| Ortiz-Deorue Laura | -- | -- | |
| Danna Dean P | $180,000 | -- |
Source: Public Records
Mortgage History
| Date | Status | Borrower | Loan Amount |
|---|---|---|---|
| Previous Owner | Danna Dean P | $144,000 |
Source: Public Records
Tax History
| Year | Tax Paid | Tax Assessment Tax Assessment Total Assessment is a certain percentage of the fair market value that is determined by local assessors to be the total taxable value of land and additions on the property. | Land | Improvement |
|---|---|---|---|---|
| 2025 | $9,565 | $242,760 | $48,370 | $194,390 |
| 2024 | $9,346 | $242,760 | $48,370 | $194,390 |
| 2023 | $9,031 | $242,760 | $48,370 | $194,390 |
| 2022 | $9,650 | $242,760 | $48,370 | $194,390 |
| 2021 | $6,908 | $157,430 | $41,650 | $115,780 |
| 2020 | $6,908 | $157,430 | $41,650 | $115,780 |
| 2019 | $6,766 | $157,430 | $41,650 | $115,780 |
| 2018 | $6,766 | $157,430 | $41,650 | $115,780 |
| 2017 | $6,089 | $157,430 | $41,650 | $115,780 |
| 2016 | $5,215 | $125,510 | $32,760 | $92,750 |
| 2015 | $5,215 | $125,510 | $32,760 | $92,750 |
| 2014 | $5,215 | $125,510 | $32,760 | $92,750 |
Source: Public Records
Map
Nearby Homes
Your Personal Tour Guide
Ask me questions while you tour the home.