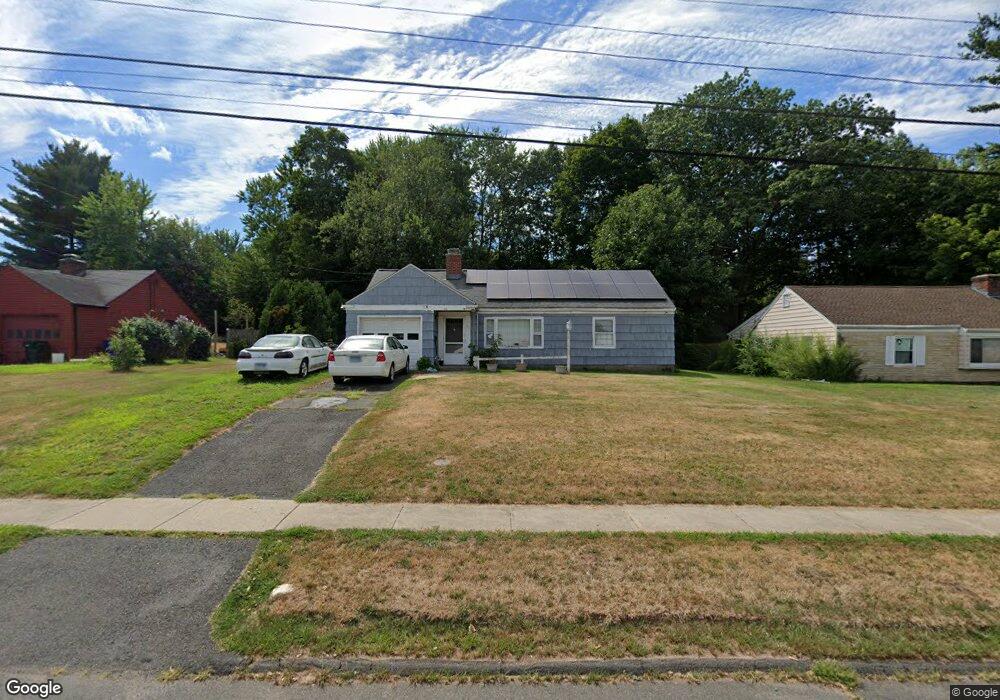
21 Mapleside Dr Wethersfield, CT 06109
Estimated Value: $265,000 - $289,397
2
Beds
1
Bath
912
Sq Ft
$302/Sq Ft
Est. Value
About This Home
This home is located at 21 Mapleside Dr, Wethersfield, CT 06109 and is currently estimated at $275,349, approximately $301 per square foot. 21 Mapleside Dr is a home located in Hartford County with nearby schools including Emerson-Williams School, Silas Deane Middle School, and Wethersfield High School.
Ownership History
Date
Name
Owned For
Owner Type
Purchase Details
Closed on
Apr 29, 2011
Sold by
Freedman Jacob A
Bought by
Freedman Linda L
Current Estimated Value
Purchase Details
Closed on
Mar 20, 1995
Sold by
Harvey Elizabeth R
Bought by
Scalora Joseph E
Create a Home Valuation Report for This Property
The Home Valuation Report is an in-depth analysis detailing your home's value as well as a comparison with similar homes in the area
Home Values in the Area
Average Home Value in this Area
Purchase History
| Date | Buyer | Sale Price | Title Company |
|---|---|---|---|
| Freedman Linda L | -- | -- | |
| Scalora Joseph E | $90,000 | -- |
Source: Public Records
Mortgage History
| Date | Status | Borrower | Loan Amount |
|---|---|---|---|
| Previous Owner | Scalora Joseph E | $188,975 | |
| Previous Owner | Scalora Joseph E | $40,000 | |
| Previous Owner | Scalora Joseph E | $143,631 |
Source: Public Records
Tax History
| Year | Tax Paid | Tax Assessment Tax Assessment Total Assessment is a certain percentage of the fair market value that is determined by local assessors to be the total taxable value of land and additions on the property. | Land | Improvement |
|---|---|---|---|---|
| 2025 | $6,605 | $160,240 | $94,740 | $65,500 |
| 2024 | $5,119 | $118,430 | $73,500 | $44,930 |
| 2023 | $4,948 | $118,430 | $73,500 | $44,930 |
| 2022 | $4,865 | $118,430 | $73,500 | $44,930 |
| 2021 | $4,817 | $118,430 | $73,500 | $44,930 |
| 2020 | $4,819 | $118,430 | $73,500 | $44,930 |
| 2019 | $4,825 | $118,430 | $73,500 | $44,930 |
| 2018 | $5,032 | $123,400 | $71,500 | $51,900 |
| 2017 | $4,908 | $123,400 | $71,500 | $51,900 |
| 2016 | $4,756 | $123,400 | $71,500 | $51,900 |
| 2015 | $4,713 | $123,400 | $71,500 | $51,900 |
| 2014 | $4,534 | $123,400 | $71,500 | $51,900 |
Source: Public Records
Map
Nearby Homes
Your Personal Tour Guide
Ask me questions while you tour the home.