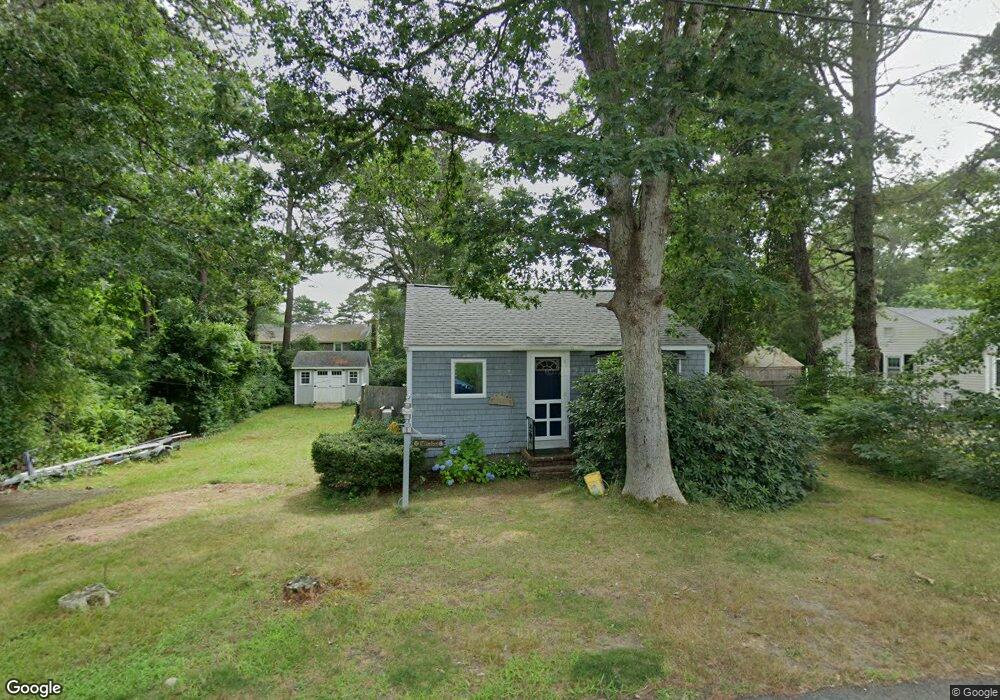
21 Mercury Ave Pocasset, MA 02559
Pocasset NeighborhoodEstimated Value: $409,343 - $483,000
2
Beds
1
Bath
864
Sq Ft
$518/Sq Ft
Est. Value
About This Home
This home is located at 21 Mercury Ave, Pocasset, MA 02559 and is currently estimated at $447,586, approximately $518 per square foot. 21 Mercury Ave is a home located in Barnstable County with nearby schools including Bourne High School, Cadence Academy Preschool - Bourne, and St Margaret Regional School.
Ownership History
Date
Name
Owned For
Owner Type
Purchase Details
Closed on
Mar 26, 2023
Sold by
Clinton Thomas J
Bought by
Clinton Thomas J and Costa Casey C
Current Estimated Value
Purchase Details
Closed on
Oct 29, 1990
Sold by
Clinton Thomas J
Bought by
Clinton Thomas J
Home Financials for this Owner
Home Financials are based on the most recent Mortgage that was taken out on this home.
Original Mortgage
$50,000
Interest Rate
10.08%
Mortgage Type
Purchase Money Mortgage
Create a Home Valuation Report for This Property
The Home Valuation Report is an in-depth analysis detailing your home's value as well as a comparison with similar homes in the area
Home Values in the Area
Average Home Value in this Area
Purchase History
| Date | Buyer | Sale Price | Title Company |
|---|---|---|---|
| Clinton Thomas J | -- | None Available | |
| Clinton Thomas J | -- | None Available | |
| Clinton Thomas J | $50,000 | -- | |
| Clinton Thomas J | $50,000 | -- |
Source: Public Records
Mortgage History
| Date | Status | Borrower | Loan Amount |
|---|---|---|---|
| Previous Owner | Clinton Thomas J | $45,000 | |
| Previous Owner | Clinton Thomas J | $50,000 |
Source: Public Records
Tax History Compared to Growth
Tax History
| Year | Tax Paid | Tax Assessment Tax Assessment Total Assessment is a certain percentage of the fair market value that is determined by local assessors to be the total taxable value of land and additions on the property. | Land | Improvement |
|---|---|---|---|---|
| 2025 | $2,770 | $354,700 | $191,900 | $162,800 |
| 2024 | $2,842 | $354,400 | $199,400 | $155,000 |
| 2023 | $2,763 | $313,600 | $176,500 | $137,100 |
| 2022 | $2,543 | $252,000 | $143,200 | $108,800 |
| 2021 | $2,470 | $229,300 | $130,300 | $99,000 |
| 2020 | $2,394 | $222,900 | $129,100 | $93,800 |
| 2019 | $2,287 | $217,600 | $129,100 | $88,500 |
| 2018 | $1,957 | $185,700 | $128,500 | $57,200 |
| 2017 | $1,894 | $183,900 | $127,300 | $56,600 |
| 2016 | $1,842 | $181,300 | $127,300 | $54,000 |
| 2015 | $1,436 | $142,600 | $88,600 | $54,000 |
Source: Public Records
Map
Nearby Homes
- 7 4th Ave
- 7 Portside Dr
- 15 1st St
- 174 Barlows Landing Rd
- 940 County Rd
- 940 County Rd
- 709 County Rd
- 254 Barlows Landing Rd
- 39 Bennets Neck Dr
- 1094 County Rd
- 3 Red Brook Pond Dr
- 171 Bellavista Dr
- 48 Red Brook Harbor Rd
- 515 County Rd
- 22 Nairn Rd
- 501 County Rd
- 16 Tara Terrace
- 1234 Route 28a
- 14 Navajo Rd
- 1234 Route 28a