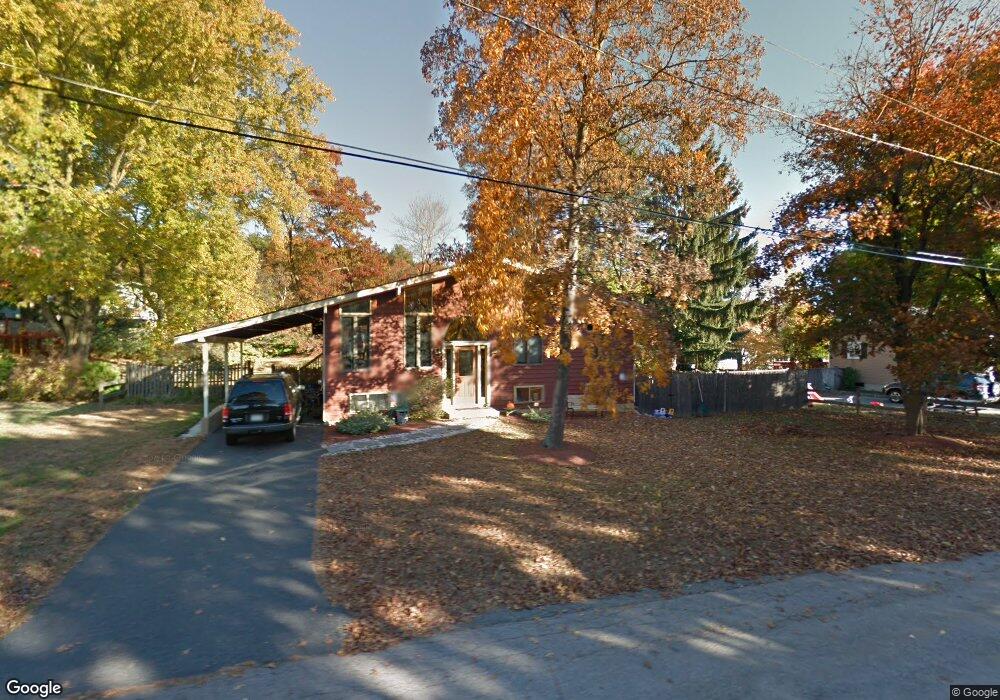
21 Meryl St Medway, MA 02053
Estimated Value: $555,000 - $585,271
3
Beds
1
Bath
960
Sq Ft
$598/Sq Ft
Est. Value
About This Home
This home is located at 21 Meryl St, Medway, MA 02053 and is currently estimated at $574,318, approximately $598 per square foot. 21 Meryl St is a home located in Norfolk County with nearby schools including John D. McGovern Elementary School, Burke-Memorial Elementary, and Medway Middle School.
Ownership History
Date
Name
Owned For
Owner Type
Purchase Details
Closed on
Sep 20, 2004
Sold by
Celli Jane L and Kelly Jane L
Bought by
Celli Francis G and Celli Jane L
Current Estimated Value
Home Financials for this Owner
Home Financials are based on the most recent Mortgage that was taken out on this home.
Original Mortgage
$249,600
Outstanding Balance
$124,811
Interest Rate
6.02%
Mortgage Type
Purchase Money Mortgage
Estimated Equity
$449,507
Purchase Details
Closed on
Oct 16, 1998
Sold by
Davis Theodore L and Davis Lydia M
Bought by
Bosselman Jane K and Bosselman Ronald J
Home Financials for this Owner
Home Financials are based on the most recent Mortgage that was taken out on this home.
Original Mortgage
$164,350
Interest Rate
6.8%
Mortgage Type
Purchase Money Mortgage
Create a Home Valuation Report for This Property
The Home Valuation Report is an in-depth analysis detailing your home's value as well as a comparison with similar homes in the area
Home Values in the Area
Average Home Value in this Area
Purchase History
| Date | Buyer | Sale Price | Title Company |
|---|---|---|---|
| Celli Francis G | -- | -- | |
| Bosselman Jane K | $173,000 | -- |
Source: Public Records
Mortgage History
| Date | Status | Borrower | Loan Amount |
|---|---|---|---|
| Open | Celli Francis G | $249,600 | |
| Previous Owner | Bosselman Jane K | $164,350 | |
| Previous Owner | Bosselman Jane K | $58,000 |
Source: Public Records
Tax History Compared to Growth
Tax History
| Year | Tax Paid | Tax Assessment Tax Assessment Total Assessment is a certain percentage of the fair market value that is determined by local assessors to be the total taxable value of land and additions on the property. | Land | Improvement |
|---|---|---|---|---|
| 2025 | $6,487 | $455,200 | $283,300 | $171,900 |
| 2024 | $6,555 | $455,200 | $283,300 | $171,900 |
| 2023 | $6,295 | $394,900 | $234,700 | $160,200 |
| 2022 | $5,976 | $353,000 | $208,400 | $144,600 |
| 2021 | $5,715 | $327,300 | $192,200 | $135,100 |
| 2020 | $5,436 | $310,600 | $178,100 | $132,500 |
| 2019 | $5,186 | $305,600 | $178,100 | $127,500 |
| 2018 | $5,208 | $294,900 | $170,000 | $124,900 |
| 2017 | $5,154 | $287,600 | $163,900 | $123,700 |
| 2016 | $4,920 | $271,700 | $157,800 | $113,900 |
| 2015 | $4,757 | $260,800 | $145,700 | $115,100 |
| 2014 | $4,936 | $262,000 | $145,700 | $116,300 |
Source: Public Records
Map
Nearby Homes
- 50 Main St
- 3 Meryl St
- 106 Holliston St
- 12 Lovering St
- 22 Sunset Dr
- 36 Lovering St
- 14 Heritage Dr
- 1 Walnut Ln
- 30 Broken Tree Rd
- 20 Broad St Unit 6
- 20 Broad St Unit A
- 20 Broad St Unit 4
- 19 Sycamore Way Unit L40
- 9 Sanford St
- 14 Sanford St Unit 15
- 280 Village St Unit D2
- 4 Shaw St
- 176 Main St Unit 3
- 16 Lexington Ln
- 28 Wellington St