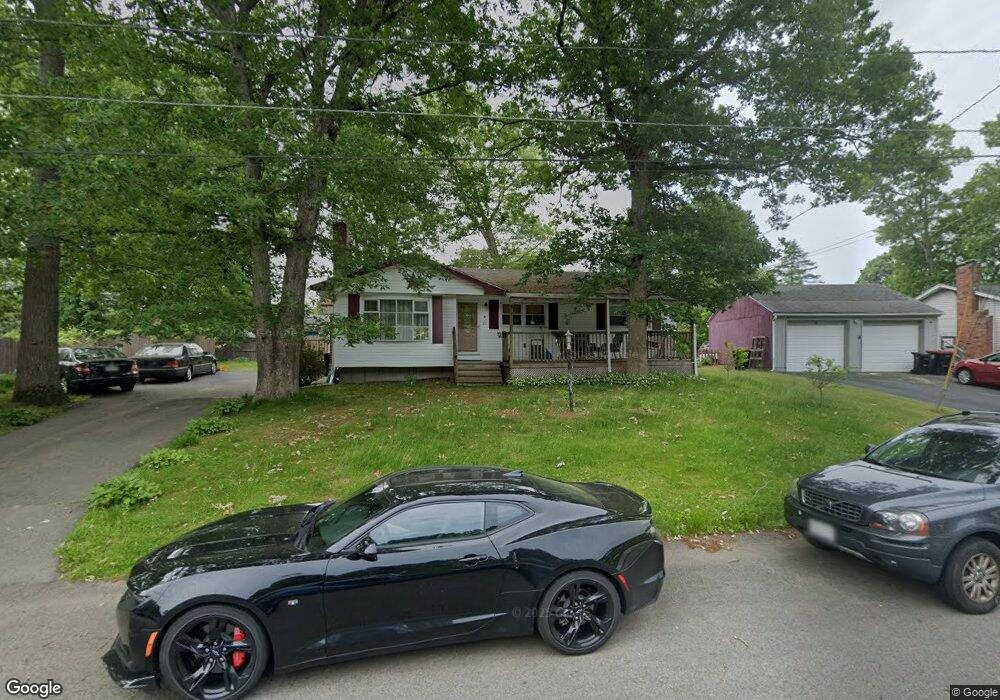
21 Morrison Rd Brockton, MA 02302
Campello NeighborhoodEstimated Value: $398,000 - $1,425,000
3
Beds
2
Baths
1,720
Sq Ft
$419/Sq Ft
Est. Value
About This Home
This home is located at 21 Morrison Rd, Brockton, MA 02302 and is currently estimated at $720,812, approximately $419 per square foot. 21 Morrison Rd is a home located in Plymouth County with nearby schools including Gilmore Elementary School, Davis K-8 School, and John F. Kennedy Elementary School.
Ownership History
Date
Name
Owned For
Owner Type
Purchase Details
Closed on
Jul 7, 2003
Sold by
Rouhana Barbara
Bought by
Rouhana Barbara A and Rouhana Marwan A
Current Estimated Value
Home Financials for this Owner
Home Financials are based on the most recent Mortgage that was taken out on this home.
Original Mortgage
$131,100
Outstanding Balance
$56,577
Interest Rate
5.46%
Mortgage Type
Purchase Money Mortgage
Estimated Equity
$664,235
Purchase Details
Closed on
Jul 2, 2001
Sold by
Martins Ramiro and Martins Maria
Bought by
Rouhana Barbara A
Home Financials for this Owner
Home Financials are based on the most recent Mortgage that was taken out on this home.
Original Mortgage
$130,000
Interest Rate
7.14%
Mortgage Type
Purchase Money Mortgage
Create a Home Valuation Report for This Property
The Home Valuation Report is an in-depth analysis detailing your home's value as well as a comparison with similar homes in the area
Home Values in the Area
Average Home Value in this Area
Purchase History
| Date | Buyer | Sale Price | Title Company |
|---|---|---|---|
| Rouhana Barbara A | $170,000 | -- | |
| Rouhana Barbara A | $170,000 | -- |
Source: Public Records
Mortgage History
| Date | Status | Borrower | Loan Amount |
|---|---|---|---|
| Open | Rouhana Barbara A | $131,100 | |
| Previous Owner | Rouhana Barbara A | $130,000 | |
| Previous Owner | Rouhana Barbara A | $62,300 |
Source: Public Records
Tax History
| Year | Tax Paid | Tax Assessment Tax Assessment Total Assessment is a certain percentage of the fair market value that is determined by local assessors to be the total taxable value of land and additions on the property. | Land | Improvement |
|---|---|---|---|---|
| 2025 | $5,201 | $429,500 | $159,500 | $270,000 |
| 2024 | $5,107 | $424,900 | $159,500 | $265,400 |
| 2023 | $4,969 | $382,800 | $109,800 | $273,000 |
| 2022 | $4,733 | $338,800 | $99,800 | $239,000 |
| 2021 | $4,528 | $312,300 | $92,400 | $219,900 |
| 2020 | $4,519 | $298,300 | $81,200 | $217,100 |
| 2019 | $4,382 | $282,000 | $77,400 | $204,600 |
| 2018 | $3,874 | $241,200 | $77,400 | $163,800 |
| 2017 | $3,664 | $227,600 | $77,400 | $150,200 |
| 2016 | $3,548 | $204,400 | $73,800 | $130,600 |
| 2015 | $3,249 | $179,000 | $73,800 | $105,200 |
| 2014 | $3,115 | $171,800 | $73,800 | $98,000 |
Source: Public Records
Map
Nearby Homes
Your Personal Tour Guide
Ask me questions while you tour the home.