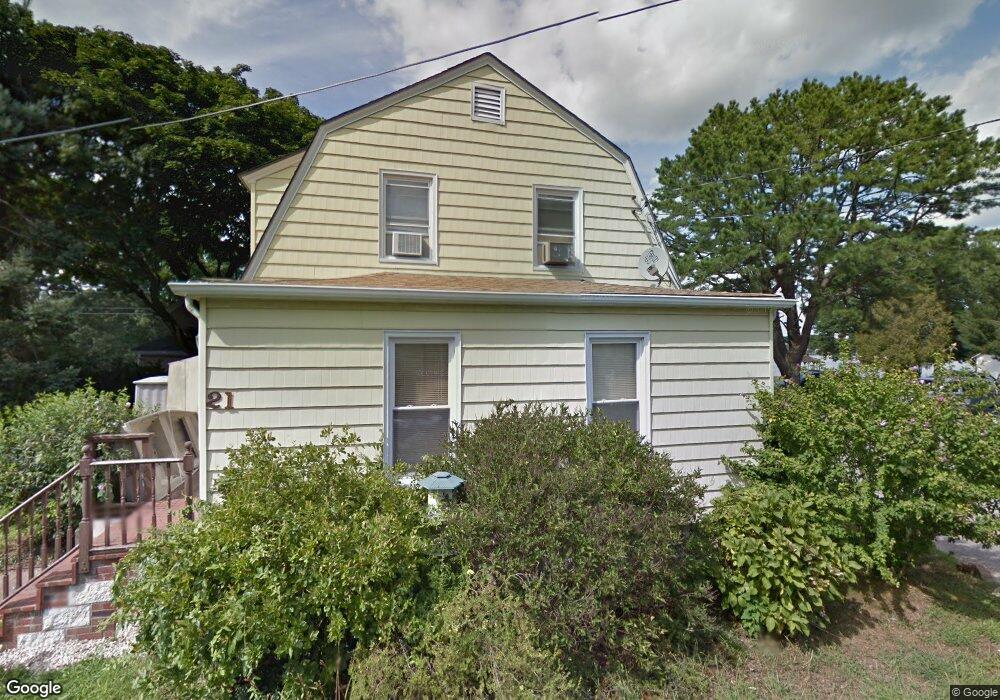
21 N Main St Niantic, CT 06357
Niantic NeighborhoodEstimated Value: $420,000 - $567,000
2
Beds
2
Baths
1,408
Sq Ft
$336/Sq Ft
Est. Value
About This Home
This home is located at 21 N Main St, Niantic, CT 06357 and is currently estimated at $473,011, approximately $335 per square foot. 21 N Main St is a home located in New London County with nearby schools including East Lyme Middle School, East Lyme High School, and The Light House Voc-Ed Center.
Ownership History
Date
Name
Owned For
Owner Type
Purchase Details
Closed on
Aug 5, 2008
Sold by
Kelly Nancy E
Bought by
Dana Deborah Clark
Current Estimated Value
Home Financials for this Owner
Home Financials are based on the most recent Mortgage that was taken out on this home.
Original Mortgage
$224,000
Interest Rate
5.87%
Purchase Details
Closed on
Jan 18, 2001
Sold by
Rovella Maria and Rovella Gaetano
Bought by
Clark-Dana Deborah
Create a Home Valuation Report for This Property
The Home Valuation Report is an in-depth analysis detailing your home's value as well as a comparison with similar homes in the area
Home Values in the Area
Average Home Value in this Area
Purchase History
| Date | Buyer | Sale Price | Title Company |
|---|---|---|---|
| Dana Deborah Clark | $215,000 | -- | |
| Hames Patricia | $280,000 | -- | |
| Clark-Dana Deborah | $179,000 | -- |
Source: Public Records
Mortgage History
| Date | Status | Borrower | Loan Amount |
|---|---|---|---|
| Closed | Clark-Dana Deborah | $195,000 | |
| Closed | Clark-Dana Deborah | $216,000 | |
| Closed | Clark-Dana Deborah | $220,000 | |
| Closed | Clark-Dana Deborah | $224,000 |
Source: Public Records
Tax History
| Year | Tax Paid | Tax Assessment Tax Assessment Total Assessment is a certain percentage of the fair market value that is determined by local assessors to be the total taxable value of land and additions on the property. | Land | Improvement |
|---|---|---|---|---|
| 2025 | $5,486 | $195,860 | $99,190 | $96,670 |
| 2024 | $5,161 | $195,860 | $99,190 | $96,670 |
| 2023 | $4,873 | $195,860 | $99,190 | $96,670 |
| 2022 | $4,669 | $195,860 | $99,190 | $96,670 |
| 2021 | $5,788 | $203,000 | $126,770 | $76,230 |
| 2020 | $5,676 | $200,130 | $126,770 | $73,360 |
| 2019 | $5,642 | $200,130 | $126,770 | $73,360 |
| 2018 | $5,474 | $200,130 | $126,770 | $73,360 |
| 2017 | $5,235 | $200,130 | $126,770 | $73,360 |
| 2016 | $5,391 | $212,590 | $137,760 | $74,830 |
| 2015 | $5,253 | $212,590 | $137,760 | $74,830 |
| 2014 | $5,109 | $212,590 | $137,760 | $74,830 |
Source: Public Records
Map
Nearby Homes
- 20 North Rd
- 47 Oswegatchie Hills Rd
- 3 E Wood St
- 11 Smith Ave
- 185 Main St Unit 301
- 185 Main St Unit 305
- 10 S Ledge Rock Rd
- 6 Fulmore Dr
- 52B Millstone Rd W
- 468 Main St Unit 318
- 468 Main St Unit 111
- 276 Niantic River Rd
- 46 Village Crossing Unit 46
- 47 Village Crossing Unit 47
- 9 Arrowhead Trail
- 37 Stoneywood Dr
- 163 Oswegatchie Rd
- 398 Boston Post Rd
- 398 & 402 Boston Post Rd
- 310 Boston Post Rd Unit 76
Your Personal Tour Guide
Ask me questions while you tour the home.