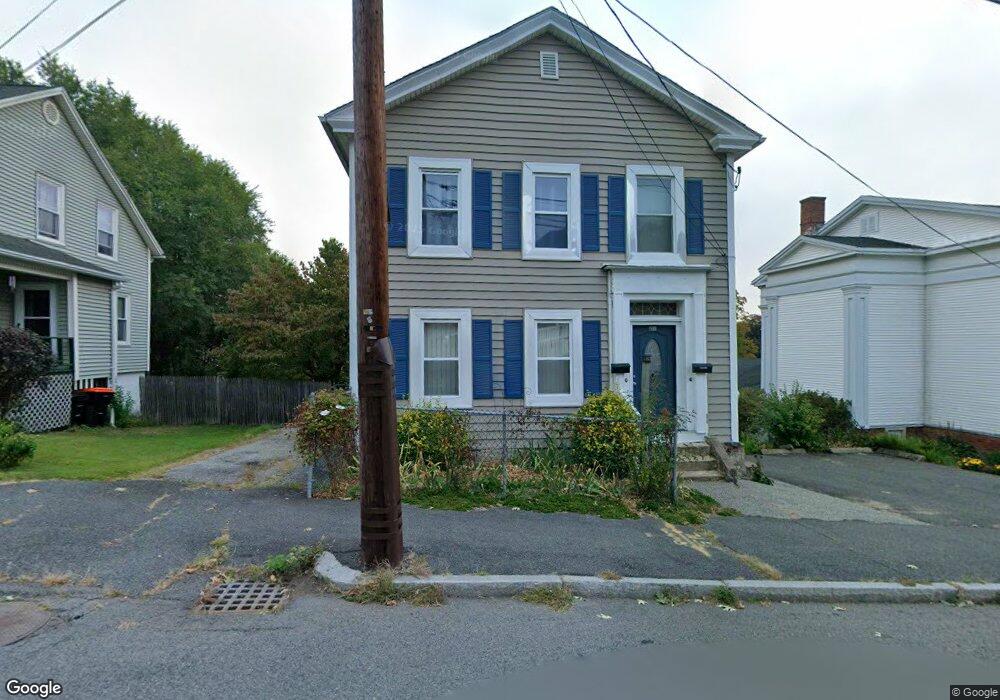
21 N Main St South Hadley, MA 01075
Estimated Value: $316,000 - $381,000
5
Beds
2
Baths
2,272
Sq Ft
$154/Sq Ft
Est. Value
About This Home
This home is located at 21 N Main St, South Hadley, MA 01075 and is currently estimated at $350,862, approximately $154 per square foot. 21 N Main St is a home located in Hampshire County with nearby schools including Plains Elementary School, Mosier Elementary School, and Michael E. Smith Middle School.
Ownership History
Date
Name
Owned For
Owner Type
Purchase Details
Closed on
Aug 21, 2002
Sold by
Guyott Albert L and Guyott Ann
Bought by
Bainbridge Robert A and Bainbridge Susan
Current Estimated Value
Home Financials for this Owner
Home Financials are based on the most recent Mortgage that was taken out on this home.
Original Mortgage
$102,400
Outstanding Balance
$43,392
Interest Rate
6.57%
Mortgage Type
Purchase Money Mortgage
Estimated Equity
$307,470
Create a Home Valuation Report for This Property
The Home Valuation Report is an in-depth analysis detailing your home's value as well as a comparison with similar homes in the area
Home Values in the Area
Average Home Value in this Area
Purchase History
| Date | Buyer | Sale Price | Title Company |
|---|---|---|---|
| Bainbridge Robert A | $128,000 | -- |
Source: Public Records
Mortgage History
| Date | Status | Borrower | Loan Amount |
|---|---|---|---|
| Open | Bainbridge Robert A | $102,400 | |
| Previous Owner | Bainbridge Robert A | $39,300 | |
| Previous Owner | Bainbridge Robert A | $45,000 |
Source: Public Records
Tax History Compared to Growth
Tax History
| Year | Tax Paid | Tax Assessment Tax Assessment Total Assessment is a certain percentage of the fair market value that is determined by local assessors to be the total taxable value of land and additions on the property. | Land | Improvement |
|---|---|---|---|---|
| 2025 | $4,752 | $298,300 | $83,400 | $214,900 |
| 2024 | $4,639 | $278,600 | $77,900 | $200,700 |
| 2023 | $4,147 | $236,300 | $70,800 | $165,500 |
| 2022 | $3,905 | $211,300 | $70,800 | $140,500 |
| 2021 | $3,783 | $194,400 | $66,300 | $128,100 |
| 2020 | $3,689 | $185,000 | $66,300 | $118,700 |
| 2019 | $3,536 | $175,500 | $63,100 | $112,400 |
| 2018 | $3,406 | $170,900 | $61,200 | $109,700 |
| 2017 | $3,439 | $170,900 | $61,200 | $109,700 |
| 2016 | $3,371 | $169,800 | $61,200 | $108,600 |
| 2015 | $3,192 | $164,700 | $59,300 | $105,400 |
Source: Public Records
Map
Nearby Homes
- 27 Bardwell St Unit 4
- 49 N Main St
- 32 North St
- 2 Arbor Way Unit C
- 41 W Summit St Unit 72
- 41 W Summit St Unit 54
- 41 W Summit St Unit 32
- 41 W Summit St Unit 55
- 48 N Canal St
- 70 Lathrop St
- 3 Ralph Ave
- 75 Elm St
- 87 Pine St
- 7 Hunter Terrace
- 63-65 Mosher St
- 20 Linden St
- 84 Judd Ave
- 246 E Dwight St
- 146 Beech St
- 12 School St