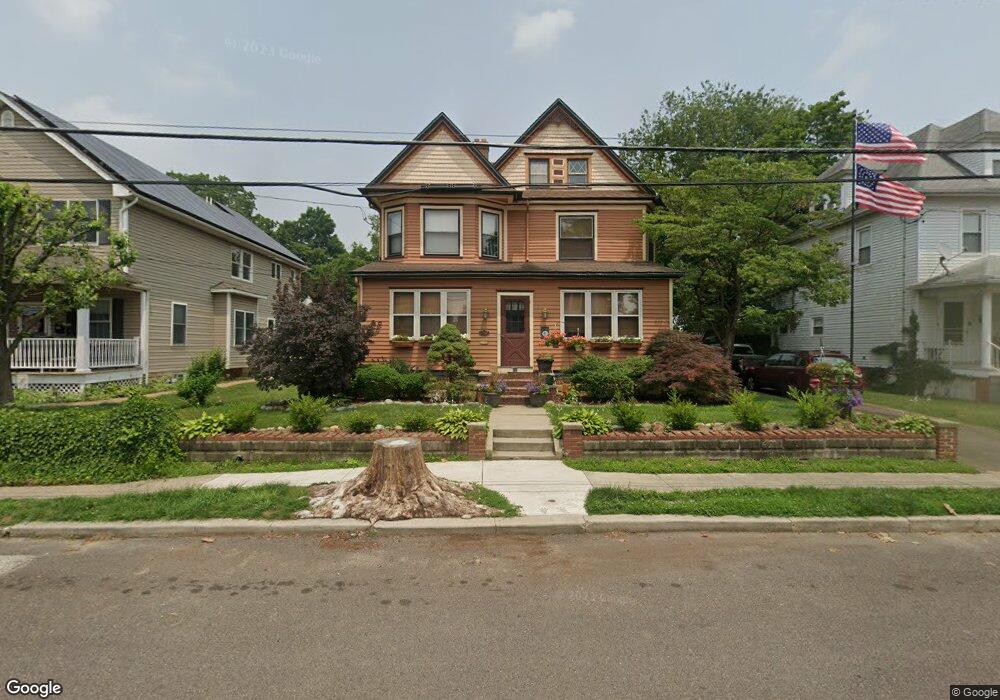
21 N Oak Ave Pitman, NJ 08071
Estimated Value: $364,000 - $423,000
--
Bed
--
Bath
1,812
Sq Ft
$223/Sq Ft
Est. Value
About This Home
This home is located at 21 N Oak Ave, Pitman, NJ 08071 and is currently estimated at $403,262, approximately $222 per square foot. 21 N Oak Ave is a home located in Gloucester County with nearby schools including Memorial Elementary School, Pitman Middle School, and Pitman High School.
Ownership History
Date
Name
Owned For
Owner Type
Purchase Details
Closed on
Jul 13, 2007
Sold by
Wolfe Edward L and Wolfe Jean L
Bought by
Conklin Joseph T and Conklin Christa R
Current Estimated Value
Home Financials for this Owner
Home Financials are based on the most recent Mortgage that was taken out on this home.
Original Mortgage
$165,000
Interest Rate
6.78%
Mortgage Type
Purchase Money Mortgage
Create a Home Valuation Report for This Property
The Home Valuation Report is an in-depth analysis detailing your home's value as well as a comparison with similar homes in the area
Home Values in the Area
Average Home Value in this Area
Purchase History
| Date | Buyer | Sale Price | Title Company |
|---|---|---|---|
| Conklin Joseph T | $310,000 | Group 21 Title Agency |
Source: Public Records
Mortgage History
| Date | Status | Borrower | Loan Amount |
|---|---|---|---|
| Closed | Conklin Joseph T | $165,000 |
Source: Public Records
Tax History Compared to Growth
Tax History
| Year | Tax Paid | Tax Assessment Tax Assessment Total Assessment is a certain percentage of the fair market value that is determined by local assessors to be the total taxable value of land and additions on the property. | Land | Improvement |
|---|---|---|---|---|
| 2025 | $10,350 | $296,300 | $52,900 | $243,400 |
| 2024 | $10,077 | $296,300 | $52,900 | $243,400 |
| 2023 | $10,077 | $296,300 | $52,900 | $243,400 |
| 2022 | $9,680 | $296,300 | $52,900 | $243,400 |
| 2021 | $9,343 | $208,400 | $50,800 | $157,600 |
| 2020 | $9,232 | $208,400 | $50,800 | $157,600 |
| 2019 | $9,015 | $208,400 | $50,800 | $157,600 |
| 2018 | $8,863 | $208,400 | $50,800 | $157,600 |
| 2017 | $8,753 | $208,400 | $50,800 | $157,600 |
| 2016 | $8,584 | $208,400 | $50,800 | $157,600 |
| 2015 | $8,353 | $206,500 | $50,800 | $155,700 |
| 2014 | $8,023 | $206,500 | $50,800 | $155,700 |
Source: Public Records
Map
Nearby Homes
- 25 N Oak Ave
- 9 N Oak Ave
- 27 N Oak Ave
- 30 N Broadway
- 30 W Holly Ave
- 33 N Oak Ave
- 106 W Holly Ave
- 18 N Oak Ave
- 110 N Broadway
- 16 W Holly Ave
- 45 N Oak Ave
- 102 N Broadway
- 30 N Oak Ave
- 114 W Holly Ave
- 116 N Broadway
- 2 East Ave
- 42 N Oak Ave
- 51 N Oak Ave
- 56-58-58 S Broadway Unit 56 B
- 56-58-58 S Broadway Unit 58 C