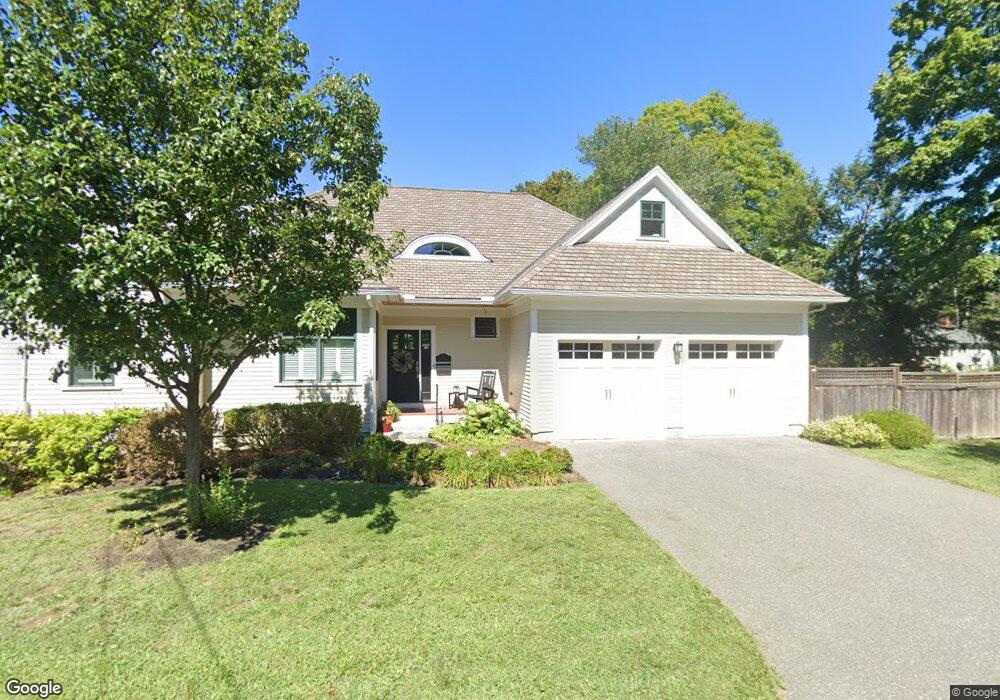
21 North St South Hamilton, MA 01982
Estimated Value: $653,000 - $1,081,000
2
Beds
1
Bath
962
Sq Ft
$952/Sq Ft
Est. Value
About This Home
This home is located at 21 North St, South Hamilton, MA 01982 and is currently estimated at $915,574, approximately $951 per square foot. 21 North St is a home located in Essex County with nearby schools including Winthrop School, Cutler Elementary School, and Bessie Buker Elementary School.
Ownership History
Date
Name
Owned For
Owner Type
Purchase Details
Closed on
Jul 5, 2013
Sold by
21 North Street Rt
Bought by
Burnham James W and Morey Linda
Current Estimated Value
Purchase Details
Closed on
Oct 28, 2011
Sold by
Campagna Diane M
Bought by
21 North St Hamilton R
Create a Home Valuation Report for This Property
The Home Valuation Report is an in-depth analysis detailing your home's value as well as a comparison with similar homes in the area
Home Values in the Area
Average Home Value in this Area
Purchase History
| Date | Buyer | Sale Price | Title Company |
|---|---|---|---|
| Burnham James W | -- | -- | |
| 21 North St Hamilton R | $234,000 | -- |
Source: Public Records
Mortgage History
| Date | Status | Borrower | Loan Amount |
|---|---|---|---|
| Previous Owner | 21 North St Hamilton R | $66,000 | |
| Previous Owner | 21 North St Hamilton R | $48,000 |
Source: Public Records
Tax History Compared to Growth
Tax History
| Year | Tax Paid | Tax Assessment Tax Assessment Total Assessment is a certain percentage of the fair market value that is determined by local assessors to be the total taxable value of land and additions on the property. | Land | Improvement |
|---|---|---|---|---|
| 2025 | $13,664 | $873,100 | $271,300 | $601,800 |
| 2024 | $13,046 | $863,400 | $271,300 | $592,100 |
| 2023 | $12,892 | $789,000 | $253,100 | $535,900 |
| 2022 | $13,026 | $728,500 | $228,700 | $499,800 |
| 2021 | $12,756 | $728,500 | $228,700 | $499,800 |
| 2020 | $11,310 | $666,100 | $229,100 | $437,000 |
| 2019 | $10,756 | $652,700 | $223,000 | $429,700 |
| 2018 | $10,047 | $619,400 | $210,200 | $409,200 |
| 2017 | $10,108 | $601,300 | $196,400 | $404,900 |
| 2016 | $9,884 | $573,000 | $180,100 | $392,900 |
| 2015 | $9,340 | $546,500 | $171,500 | $375,000 |
| 2014 | $9,801 | $563,300 | $194,800 | $368,500 |
Source: Public Records
Map
Nearby Homes