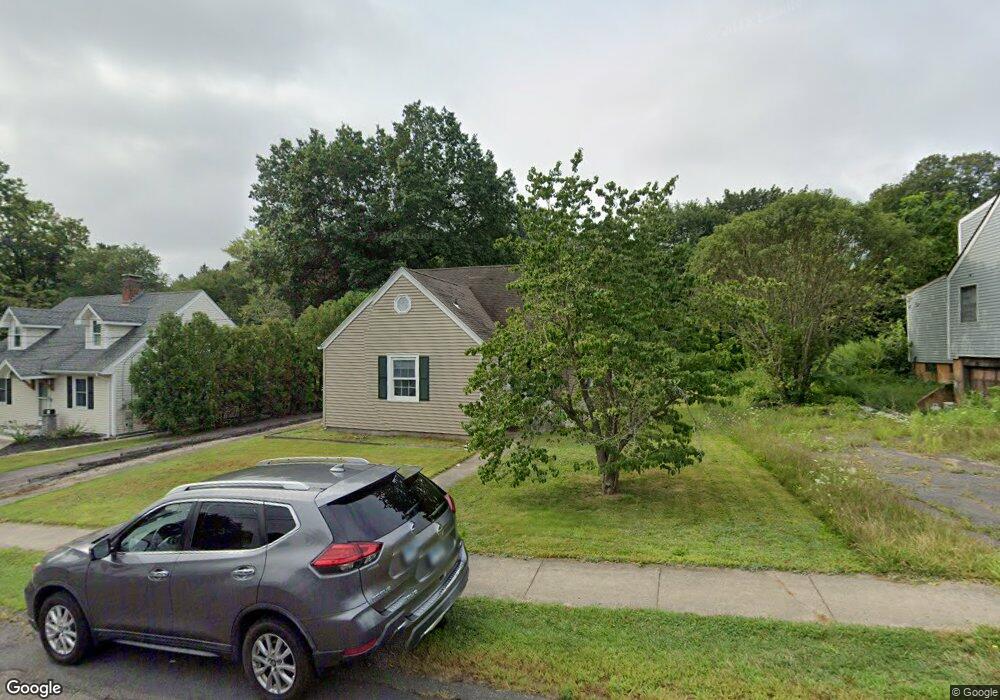
21 Parker St Enfield, CT 06082
Estimated Value: $300,000 - $325,000
3
Beds
2
Baths
1,571
Sq Ft
$201/Sq Ft
Est. Value
About This Home
This home is located at 21 Parker St, Enfield, CT 06082 and is currently estimated at $315,237, approximately $200 per square foot. 21 Parker St is a home located in Hartford County with nearby schools including Prudence Crandall Elementary School, Henry Barnard Elementary School, and John F. Kennedy Middle School.
Ownership History
Date
Name
Owned For
Owner Type
Purchase Details
Closed on
May 20, 2010
Sold by
Arbogast Danny and Arbogast Maureen
Bought by
Fraher Christopher and Hayden Elizabeth
Current Estimated Value
Home Financials for this Owner
Home Financials are based on the most recent Mortgage that was taken out on this home.
Original Mortgage
$183,528
Outstanding Balance
$125,690
Interest Rate
5.5%
Mortgage Type
FHA
Estimated Equity
$189,547
Purchase Details
Closed on
Jan 8, 1993
Sold by
Mcu Fncl Corp
Bought by
Arbogast Danny and Arbogast Maureen
Home Financials for this Owner
Home Financials are based on the most recent Mortgage that was taken out on this home.
Original Mortgage
$106,800
Interest Rate
2%
Mortgage Type
Unknown
Purchase Details
Closed on
Oct 1, 1992
Sold by
Carollo James and Carollo Patricia
Bought by
Mcu Financial Corp
Create a Home Valuation Report for This Property
The Home Valuation Report is an in-depth analysis detailing your home's value as well as a comparison with similar homes in the area
Home Values in the Area
Average Home Value in this Area
Purchase History
| Date | Buyer | Sale Price | Title Company |
|---|---|---|---|
| Fraher Christopher | $186,000 | -- | |
| Arbogast Danny | $108,000 | -- | |
| Mcu Financial Corp | $120,000 | -- |
Source: Public Records
Mortgage History
| Date | Status | Borrower | Loan Amount |
|---|---|---|---|
| Open | Mcu Financial Corp | $183,528 | |
| Previous Owner | Mcu Financial Corp | $176,300 | |
| Previous Owner | Mcu Financial Corp | $120,000 | |
| Previous Owner | Mcu Financial Corp | $106,800 |
Source: Public Records
Tax History Compared to Growth
Tax History
| Year | Tax Paid | Tax Assessment Tax Assessment Total Assessment is a certain percentage of the fair market value that is determined by local assessors to be the total taxable value of land and additions on the property. | Land | Improvement |
|---|---|---|---|---|
| 2025 | $5,770 | $154,700 | $50,200 | $104,500 |
| 2024 | $5,616 | $154,700 | $50,200 | $104,500 |
| 2023 | $5,616 | $154,700 | $50,200 | $104,500 |
| 2022 | $5,203 | $154,700 | $50,200 | $104,500 |
| 2021 | $4,931 | $120,010 | $41,560 | $78,450 |
| 2020 | $4,883 | $120,010 | $41,560 | $78,450 |
| 2019 | $4,923 | $120,010 | $41,560 | $78,450 |
| 2018 | $4,816 | $120,010 | $41,560 | $78,450 |
| 2017 | $4,773 | $120,010 | $41,560 | $78,450 |
| 2016 | $4,630 | $118,100 | $41,560 | $76,540 |
| 2015 | $4,515 | $118,100 | $41,560 | $76,540 |
| 2014 | $4,296 | $118,100 | $41,560 | $76,540 |
Source: Public Records
Map
Nearby Homes