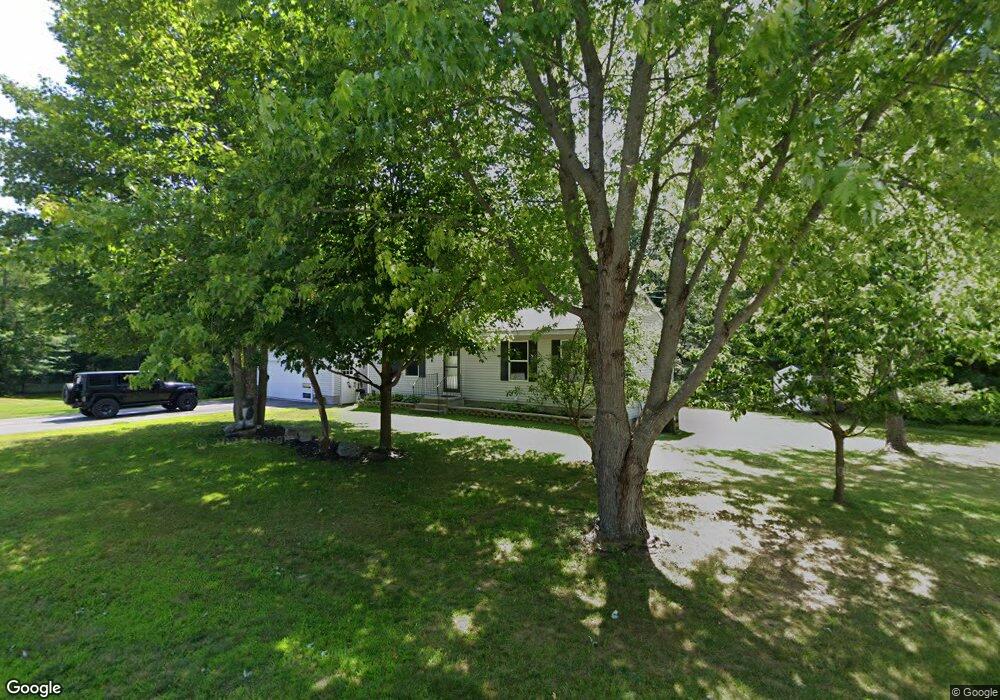
21 Poplar Cir Lisbon, ME 04250
Estimated Value: $339,000 - $349,000
2
Beds
1
Bath
960
Sq Ft
$358/Sq Ft
Est. Value
About This Home
This home is located at 21 Poplar Cir, Lisbon, ME 04250 and is currently estimated at $343,686, approximately $358 per square foot. 21 Poplar Cir is a home located in Androscoggin County with nearby schools including Lisbon Community School, Philip W. Sugg Middle School, and Lisbon High School.
Ownership History
Date
Name
Owned For
Owner Type
Purchase Details
Closed on
Feb 2, 2024
Sold by
Davis James F
Bought by
James F Davis T F and James Davis
Current Estimated Value
Purchase Details
Closed on
May 20, 2005
Sold by
Custom Built Homes Of Me
Bought by
Davis James F and Davis Lisa R
Home Financials for this Owner
Home Financials are based on the most recent Mortgage that was taken out on this home.
Original Mortgage
$153,917
Interest Rate
5.95%
Mortgage Type
Commercial
Create a Home Valuation Report for This Property
The Home Valuation Report is an in-depth analysis detailing your home's value as well as a comparison with similar homes in the area
Home Values in the Area
Average Home Value in this Area
Purchase History
| Date | Buyer | Sale Price | Title Company |
|---|---|---|---|
| James F Davis T F | -- | None Available | |
| Davis James F | -- | -- |
Source: Public Records
Mortgage History
| Date | Status | Borrower | Loan Amount |
|---|---|---|---|
| Previous Owner | Davis James F | $153,917 |
Source: Public Records
Tax History Compared to Growth
Tax History
| Year | Tax Paid | Tax Assessment Tax Assessment Total Assessment is a certain percentage of the fair market value that is determined by local assessors to be the total taxable value of land and additions on the property. | Land | Improvement |
|---|---|---|---|---|
| 2024 | $4,196 | $308,500 | $69,700 | $238,800 |
| 2023 | $3,397 | $161,000 | $46,000 | $115,000 |
| 2022 | $3,719 | $161,000 | $46,000 | $115,000 |
| 2021 | $3,558 | $161,000 | $46,000 | $115,000 |
| 2020 | $3,719 | $161,000 | $46,000 | $115,000 |
| 2019 | $3,719 | $161,000 | $46,000 | $115,000 |
| 2018 | $3,485 | $140,300 | $40,000 | $100,300 |
| 2017 | $3,255 | $140,300 | $40,000 | $100,300 |
| 2016 | $3,145 | $140,400 | $40,000 | $100,400 |
| 2015 | $2,602 | $119,000 | $42,200 | $76,800 |
| 2014 | $2,694 | $119,000 | $42,200 | $76,800 |
| 2013 | -- | $119,000 | $42,200 | $76,800 |
Source: Public Records
Map
Nearby Homes
- 46 Beech St
- 48 Fairview Dr
- 38 Fairview Dr
- 44 Fairview Dr
- 9 Willow Cir
- 20 Town And Country Dr
- 25 Wine Time Cir
- 219 Lisbon St
- M.R6 Lot18 Lisbon St
- 5 Bonafide St
- 13 Saint Ann St
- 10 Alma Dr
- 272 Lisbon St
- 53 Ferry Rd
- 103 Lisbon St
- 26 Stanley Dr
- 69 Lisbon Street Lots F & G
- 15 Gayton Rd
- 7 Alexander St
- 9 Irene St