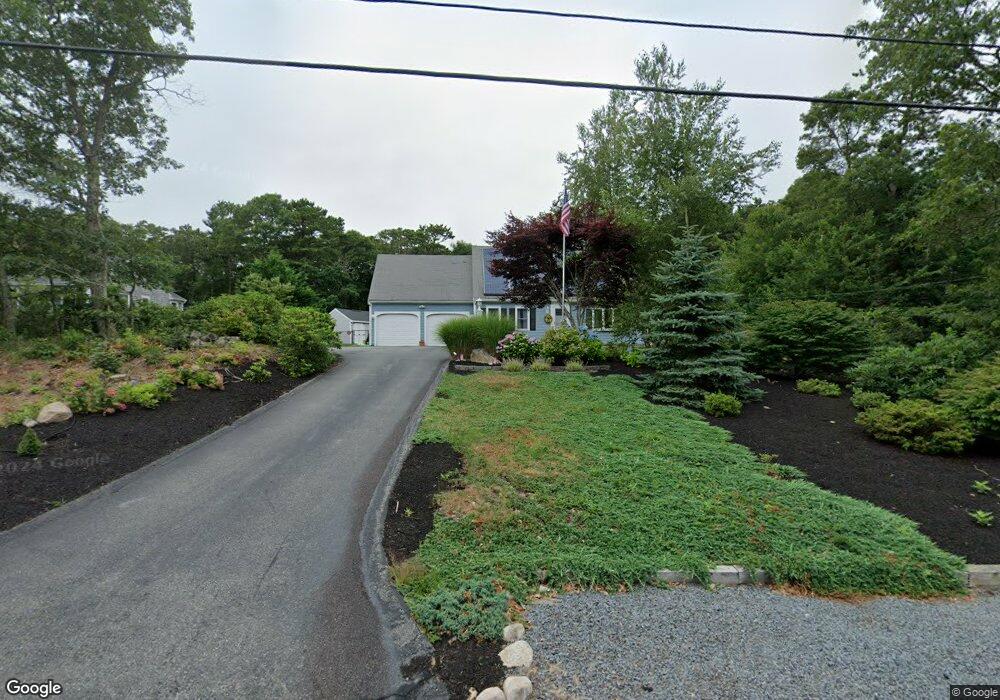
21 Portside Dr Pocasset, MA 02559
Pocasset NeighborhoodEstimated Value: $689,513 - $835,000
2
Beds
2
Baths
2,168
Sq Ft
$354/Sq Ft
Est. Value
About This Home
This home is located at 21 Portside Dr, Pocasset, MA 02559 and is currently estimated at $767,128, approximately $353 per square foot. 21 Portside Dr is a home located in Barnstable County with nearby schools including Bourne High School, Cadence Academy Preschool - Bourne, and St Margaret Regional School.
Ownership History
Date
Name
Owned For
Owner Type
Purchase Details
Closed on
Sep 10, 2009
Sold by
Kelley Michael C
Bought by
Kelley Michael C and Kelley Colleen A
Current Estimated Value
Home Financials for this Owner
Home Financials are based on the most recent Mortgage that was taken out on this home.
Original Mortgage
$154,000
Outstanding Balance
$100,765
Interest Rate
5.36%
Mortgage Type
Purchase Money Mortgage
Estimated Equity
$666,363
Create a Home Valuation Report for This Property
The Home Valuation Report is an in-depth analysis detailing your home's value as well as a comparison with similar homes in the area
Home Values in the Area
Average Home Value in this Area
Purchase History
| Date | Buyer | Sale Price | Title Company |
|---|---|---|---|
| Kelley Michael C | -- | -- | |
| Kelley Michael C | -- | -- |
Source: Public Records
Mortgage History
| Date | Status | Borrower | Loan Amount |
|---|---|---|---|
| Open | Kelley Michael C | $154,000 | |
| Closed | Kelley Michael C | $154,000 |
Source: Public Records
Tax History Compared to Growth
Tax History
| Year | Tax Paid | Tax Assessment Tax Assessment Total Assessment is a certain percentage of the fair market value that is determined by local assessors to be the total taxable value of land and additions on the property. | Land | Improvement |
|---|---|---|---|---|
| 2025 | $5,100 | $653,000 | $194,300 | $458,700 |
| 2024 | $4,569 | $569,700 | $185,000 | $384,700 |
| 2023 | $4,478 | $508,300 | $163,700 | $344,600 |
| 2022 | $4,254 | $421,600 | $144,900 | $276,700 |
| 2021 | $4,134 | $383,800 | $131,900 | $251,900 |
| 2020 | $3,914 | $364,400 | $130,600 | $233,800 |
| 2019 | $3,718 | $353,800 | $130,600 | $223,200 |
| 2018 | $3,577 | $339,400 | $124,400 | $215,000 |
| 2017 | $3,462 | $336,100 | $123,200 | $212,900 |
| 2016 | $3,297 | $324,500 | $117,100 | $207,400 |
| 2015 | $3,268 | $324,500 | $117,100 | $207,400 |
Source: Public Records
Map
Nearby Homes