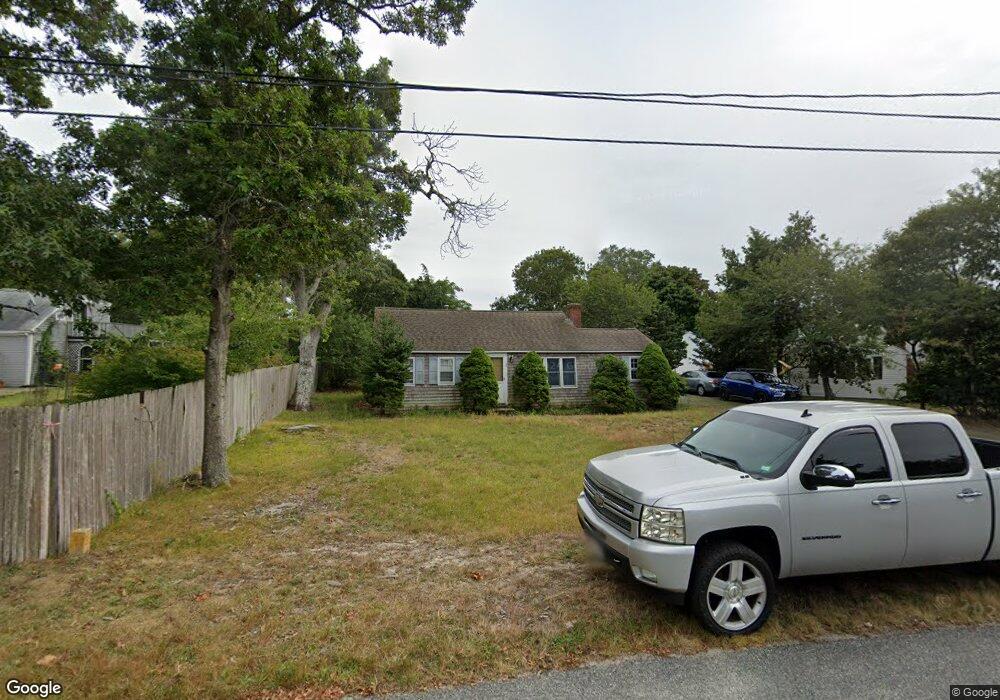
21 Powhatan Rd South Yarmouth, MA 02664
Estimated Value: $470,000 - $550,000
2
Beds
1
Bath
870
Sq Ft
$569/Sq Ft
Est. Value
About This Home
This home is located at 21 Powhatan Rd, South Yarmouth, MA 02664 and is currently estimated at $494,696, approximately $568 per square foot. 21 Powhatan Rd is a home located in Barnstable County with nearby schools including Dennis-Yarmouth Regional High School and St. Pius X. School.
Ownership History
Date
Name
Owned For
Owner Type
Purchase Details
Closed on
Sep 1, 2017
Sold by
Hardiman David J and Hardiman Nancy E
Bought by
Lowell Robert N
Current Estimated Value
Home Financials for this Owner
Home Financials are based on the most recent Mortgage that was taken out on this home.
Original Mortgage
$110,000
Outstanding Balance
$59,445
Interest Rate
3.96%
Mortgage Type
New Conventional
Estimated Equity
$435,251
Purchase Details
Closed on
Mar 11, 2004
Sold by
Fidencio Simone A and Fidencio Valter C
Bought by
Hardiman David J and Hardiman Nancy E
Purchase Details
Closed on
Dec 27, 2001
Sold by
Sexton Frederick P and Sexton Patricia A
Bought by
Fidencio Walter C and Fedencio Simone A
Home Financials for this Owner
Home Financials are based on the most recent Mortgage that was taken out on this home.
Original Mortgage
$166,881
Interest Rate
6.61%
Mortgage Type
Purchase Money Mortgage
Create a Home Valuation Report for This Property
The Home Valuation Report is an in-depth analysis detailing your home's value as well as a comparison with similar homes in the area
Home Values in the Area
Average Home Value in this Area
Purchase History
| Date | Buyer | Sale Price | Title Company |
|---|---|---|---|
| Lowell Robert N | $150,000 | -- | |
| Hardiman David J | $229,000 | -- | |
| Fidencio Walter C | $169,500 | -- |
Source: Public Records
Mortgage History
| Date | Status | Borrower | Loan Amount |
|---|---|---|---|
| Open | Lowell Robert N | $110,000 | |
| Previous Owner | Fidencio Walter C | $166,490 | |
| Previous Owner | Fidencio Walter C | $166,881 |
Source: Public Records
Tax History Compared to Growth
Tax History
| Year | Tax Paid | Tax Assessment Tax Assessment Total Assessment is a certain percentage of the fair market value that is determined by local assessors to be the total taxable value of land and additions on the property. | Land | Improvement |
|---|---|---|---|---|
| 2025 | $2,819 | $398,200 | $180,000 | $218,200 |
| 2024 | $2,603 | $352,700 | $152,200 | $200,500 |
| 2023 | $2,510 | $309,500 | $131,700 | $177,800 |
| 2022 | $2,400 | $261,400 | $119,700 | $141,700 |
| 2021 | $2,294 | $240,000 | $119,700 | $120,300 |
| 2020 | $2,314 | $231,400 | $119,700 | $111,700 |
| 2019 | $2,175 | $215,300 | $119,700 | $95,600 |
| 2018 | $2,033 | $197,600 | $102,000 | $95,600 |
| 2017 | $1,935 | $193,100 | $97,500 | $95,600 |
| 2016 | $1,839 | $184,300 | $88,700 | $95,600 |
| 2015 | $1,742 | $173,500 | $88,700 | $84,800 |
Source: Public Records
Map
Nearby Homes