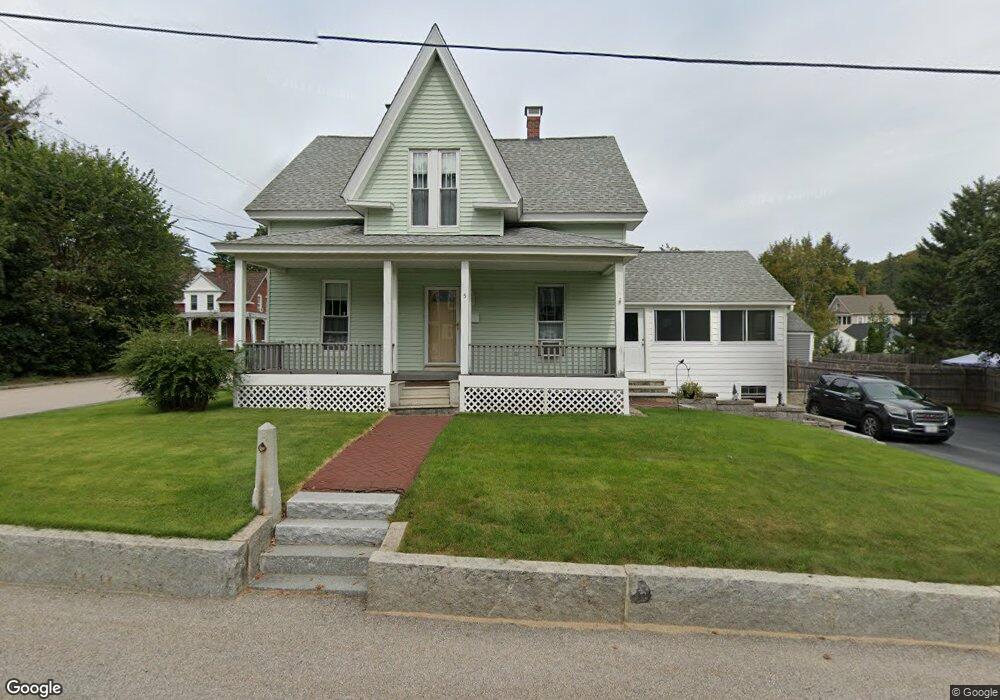
21 Prospect St Pembroke, NH 03275
Suncook NeighborhoodEstimated Value: $434,000 - $493,000
About This Home
This home is located at 21 Prospect St, Pembroke, NH 03275 and is currently estimated at $452,688, approximately $203 per square foot. 21 Prospect St is a home located in Merrimack County with nearby schools including Pembroke Village School, Pembroke Hill School, and Three Rivers School.
Ownership History
We collect this data history from publicly available records. To have your information removed, we recommend requesting removal directly through your county’s website.
Purchase Details
Home Values in the Area
Average Home Value in this Area
Purchase History
We collect this data history from publicly available records. To have your information removed, we recommend requesting removal directly through your county’s website.
| Date | Buyer | Sale Price | Title Company |
|---|---|---|---|
| $105,900 | -- |
Mortgage History
We collect this data history from publicly available records. To have your information removed, we recommend requesting removal directly through your county’s website.
| Date | Status | Borrower | Loan Amount |
|---|---|---|---|
| Open | $50,000 | ||
| Open | $150,214 | ||
| Closed | $171,000 |
Tax History
We collect this data history from publicly available records. To have your information removed, we recommend requesting removal directly through your county’s website.
| Year | Tax Paid | Tax Assessment Tax Assessment Total Assessment is a certain percentage of the fair market value that is determined by local assessors to be the total taxable value of land and additions on the property. | Land | Improvement |
|---|---|---|---|---|
| 2025 | $8,133 | $372,400 | $97,800 | $274,600 |
| 2024 | $7,086 | $360,800 | $97,800 | $263,000 |
| 2023 | $6,739 | $241,700 | $65,200 | $176,500 |
| 2022 | $5,978 | $240,100 | $65,200 | $174,900 |
| 2021 | $5,762 | $240,100 | $65,200 | $174,900 |
| 2020 | $5,906 | $240,100 | $65,200 | $174,900 |
| 2019 | $5,662 | $240,100 | $65,200 | $174,900 |
| 2018 | $5,618 | $214,100 | $59,200 | $154,900 |
| 2017 | $6,372 | $214,100 | $59,200 | $154,900 |
| 2015 | $5,140 | $177,600 | $46,300 | $131,300 |
| 2014 | $5,275 | $177,600 | $46,300 | $131,300 |
| 2011 | $4,873 | $184,300 | $51,500 | $132,800 |
Map
- 9 Pleasant St
- 160 Main St
- 163-165 Main St
- 6 Central St
- 25-31 Front St
- 33-39 Front St
- 25 Front St
- 100 Main St Unit M3
- 8 Mill Falls Rd
- 79 Keystone Ln
- 14 Brittany Cir
- 214 Cardigan Dr Unit B
- 7 School St
- 7 Willow St
- 41 Main St
- 241 Pembroke St
- 35 Cross St
- 433 Dawn Dr Unit 18
- 432 Dawn Dr Unit 19
- 430 Dawn Dr Unit 20
Ask me questions while you tour the home.