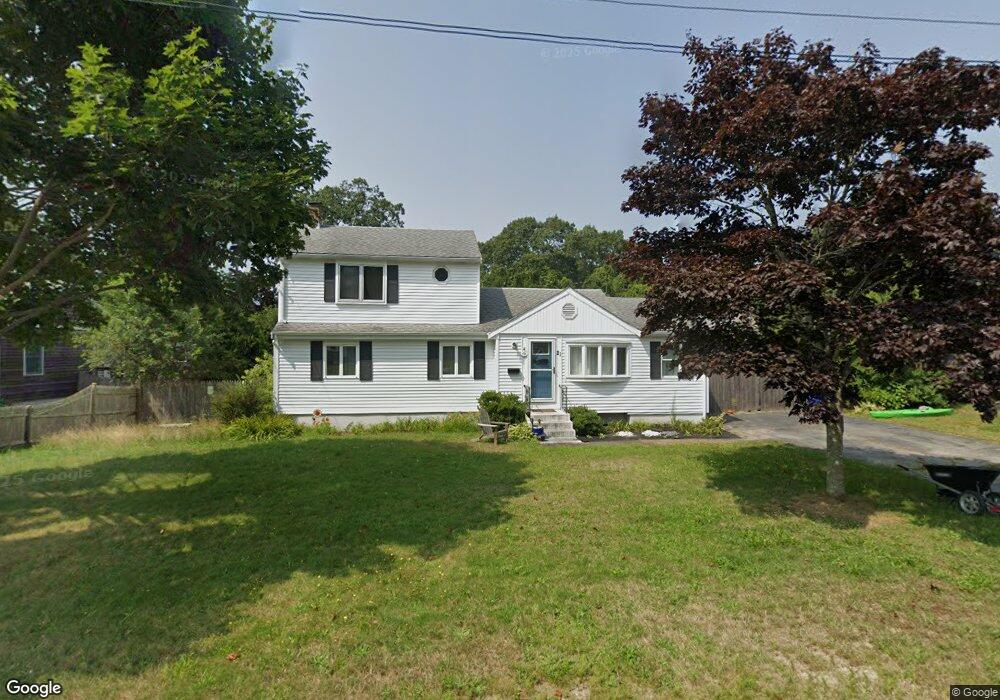
21 Queens Bay Ln Bourne, MA 2532
Buzzards Bay NeighborhoodEstimated Value: $568,000 - $589,000
5
Beds
2
Baths
1,484
Sq Ft
$391/Sq Ft
Est. Value
About This Home
This home is located at 21 Queens Bay Ln, Bourne, MA 2532 and is currently estimated at $580,203, approximately $390 per square foot. 21 Queens Bay Ln is a home located in Barnstable County with nearby schools including Bourne High School and St Margaret Regional School.
Ownership History
Date
Name
Owned For
Owner Type
Purchase Details
Closed on
Jun 10, 2021
Sold by
Campbell Theresa M
Bought by
Valchuis Robert F
Current Estimated Value
Home Financials for this Owner
Home Financials are based on the most recent Mortgage that was taken out on this home.
Original Mortgage
$360,000
Outstanding Balance
$324,512
Interest Rate
2.9%
Mortgage Type
Purchase Money Mortgage
Estimated Equity
$255,691
Purchase Details
Closed on
May 11, 2018
Sold by
2012 Llc
Bought by
Campbell Theresa M
Purchase Details
Closed on
Sep 18, 2017
Sold by
Woollam Steven A and Washington T Co
Bought by
2012 Llc
Home Financials for this Owner
Home Financials are based on the most recent Mortgage that was taken out on this home.
Original Mortgage
$230,000
Interest Rate
3.93%
Mortgage Type
New Conventional
Purchase Details
Closed on
Jan 21, 1993
Sold by
Higney Leonard F and Higney Carol F
Bought by
Woolam Steven A and Woollam Sandra S
Create a Home Valuation Report for This Property
The Home Valuation Report is an in-depth analysis detailing your home's value as well as a comparison with similar homes in the area
Home Values in the Area
Average Home Value in this Area
Purchase History
| Date | Buyer | Sale Price | Title Company |
|---|---|---|---|
| Valchuis Robert F | $450,000 | None Available | |
| Valchuis Robert F | $450,000 | None Available | |
| Campbell Theresa M | $335,000 | -- | |
| Campbell Theresa M | $335,000 | -- | |
| 2012 Llc | $169,000 | -- | |
| 2012 Llc | $169,000 | -- | |
| Woolam Steven A | $113,000 | -- | |
| Woolam Steven A | $113,000 | -- |
Source: Public Records
Mortgage History
| Date | Status | Borrower | Loan Amount |
|---|---|---|---|
| Open | Valchuis Robert F | $360,000 | |
| Closed | Valchuis Robert F | $360,000 | |
| Previous Owner | 2012 Llc | $230,000 | |
| Previous Owner | Woolam Steven A | $89,000 | |
| Previous Owner | Woolam Steven A | $145,000 |
Source: Public Records
Tax History Compared to Growth
Tax History
| Year | Tax Paid | Tax Assessment Tax Assessment Total Assessment is a certain percentage of the fair market value that is determined by local assessors to be the total taxable value of land and additions on the property. | Land | Improvement |
|---|---|---|---|---|
| 2025 | $3,853 | $493,400 | $181,100 | $312,300 |
| 2024 | $3,769 | $469,900 | $172,500 | $297,400 |
| 2023 | $3,662 | $415,700 | $152,600 | $263,100 |
| 2022 | $3,440 | $340,900 | $135,100 | $205,800 |
| 2021 | $3,342 | $310,300 | $122,900 | $187,400 |
| 2020 | $3,224 | $300,200 | $121,800 | $178,400 |
| 2019 | $2,817 | $268,000 | $121,800 | $146,200 |
| 2018 | $2,460 | $233,400 | $110,200 | $123,200 |
| 2017 | $2,379 | $231,000 | $109,100 | $121,900 |
| 2016 | $2,172 | $213,800 | $97,600 | $116,200 |
| 2015 | $2,153 | $213,800 | $97,600 | $116,200 |
Source: Public Records
Map
Nearby Homes
- 17 Maple St
- 3 Wolf Rd
- 34 Washington Ave
- 41 Lewis Point Rd
- 151 - 153 Main St
- 46 Holt Rd
- 46 Holt Rd Unit A
- 16 Washington Ave
- 0 Lewis Point Rd
- 65 Lewis Point Rd
- 162 Puritan Rd
- 73 Lewis Point Rd
- 56 Rip Van Winkle Way
- 171 Puritan Rd
- 304 Main St
- 4 Knob Ln
- 9 Hideaway Rd Unit F
- 38 Old Bridge Rd
- 27 Baker Ln Unit 27H
- 13 Hideaway Village Unit G
- 21 Queens Bay Ln
- 23 Queens Bay Ln
- 19 Queens Bay Ln
- 19 Queens Bay Ln
- 23 Queens Bay Ln
- 54 Puritan Rd
- 20 Queens Bay Ln
- 52 Puritan Rd
- 56 Puritan Rd
- 52 Puritan Rd
- 20 Queens Bay Ln
- 22 Queens Bay Ln
- 17 Queens Bay Ln
- 17 Queens Bay Ln
- 3 Colonial Rd
- 18 Queens Bay Ln
- 3 Colonial Rd
- 50 Puritan Rd
- 9 Colonial Rd
- 50 Puritan Rd