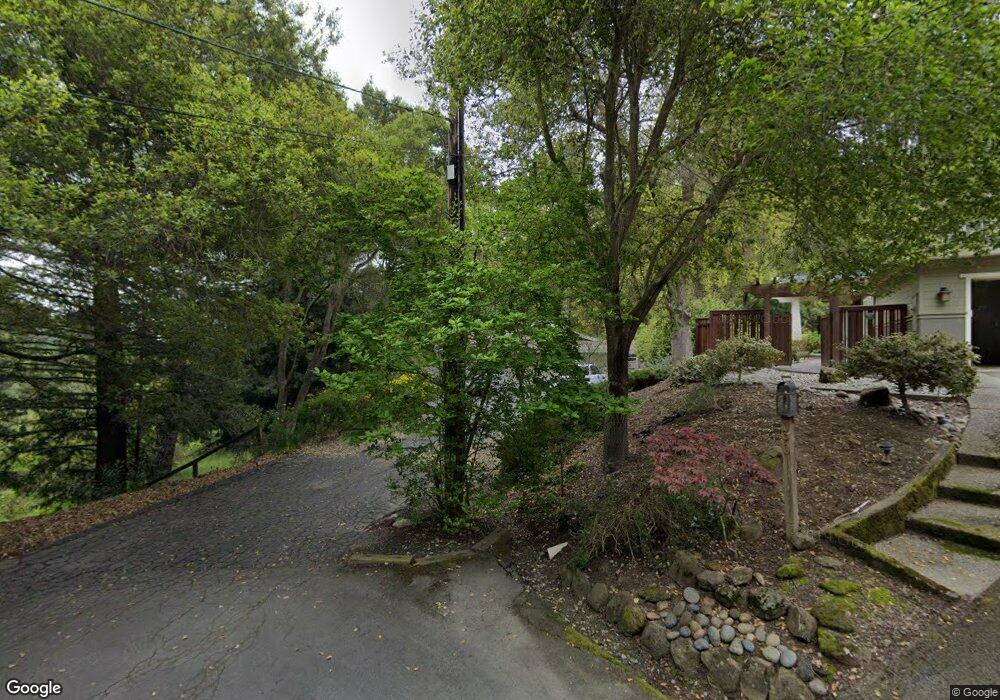
21 Queensbrook Place Orinda, CA 94563
Central Orinda NeighborhoodEstimated Value: $2,002,000 - $2,285,000
3
Beds
3
Baths
2,466
Sq Ft
$864/Sq Ft
Est. Value
About This Home
This home is located at 21 Queensbrook Place, Orinda, CA 94563 and is currently estimated at $2,130,989, approximately $864 per square foot. 21 Queensbrook Place is a home located in Contra Costa County with nearby schools including Del Rey Elementary School, Orinda Intermediate School, and Miramonte High School.
Ownership History
Date
Name
Owned For
Owner Type
Purchase Details
Closed on
Nov 10, 2022
Sold by
Christie Batterman-Jordan 2012 Trust
Bought by
Jordan Christopher Scott
Current Estimated Value
Purchase Details
Closed on
Aug 28, 2013
Sold by
Batterman Jordan Christie
Bought by
Batterman Jordan Christie
Purchase Details
Closed on
Jul 15, 1997
Sold by
Clapp Janice and Clapp Janice Joyce
Bought by
Jordan James B and Jordan Christie Batterman
Home Financials for this Owner
Home Financials are based on the most recent Mortgage that was taken out on this home.
Original Mortgage
$225,000
Interest Rate
6.95%
Mortgage Type
Purchase Money Mortgage
Purchase Details
Closed on
Nov 26, 1996
Sold by
Clapp Janice Joyce and Clapp Janet Joyce
Bought by
Clapp Janice Joyce
Create a Home Valuation Report for This Property
The Home Valuation Report is an in-depth analysis detailing your home's value as well as a comparison with similar homes in the area
Home Values in the Area
Average Home Value in this Area
Purchase History
| Date | Buyer | Sale Price | Title Company |
|---|---|---|---|
| Jordan Christopher Scott | -- | -- | |
| Batterman Jordan Christie | -- | None Available | |
| Jordan James B | $425,000 | Placer Title Company | |
| Clapp Janice Joyce | -- | -- |
Source: Public Records
Mortgage History
| Date | Status | Borrower | Loan Amount |
|---|---|---|---|
| Previous Owner | Jordan James B | $225,000 |
Source: Public Records
Tax History
| Year | Tax Paid | Tax Assessment Tax Assessment Total Assessment is a certain percentage of the fair market value that is determined by local assessors to be the total taxable value of land and additions on the property. | Land | Improvement |
|---|---|---|---|---|
| 2025 | $26,197 | $2,122,415 | $1,443,242 | $679,173 |
| 2024 | $25,436 | $2,080,800 | $1,414,944 | $665,856 |
| 2023 | $25,436 | $2,040,000 | $1,387,200 | $652,800 |
| 2022 | $8,585 | $592,019 | $289,589 | $302,430 |
| 2021 | $8,417 | $580,411 | $283,911 | $296,500 |
| 2019 | $8,290 | $563,197 | $275,491 | $287,706 |
| 2018 | $7,703 | $552,155 | $270,090 | $282,065 |
| 2017 | $7,480 | $541,330 | $264,795 | $276,535 |
| 2016 | $7,299 | $530,716 | $259,603 | $271,113 |
| 2015 | $7,249 | $522,745 | $255,704 | $267,041 |
| 2014 | $7,142 | $512,507 | $250,696 | $261,811 |
Source: Public Records
Map
Nearby Homes
- 12 La Sombra Ct
- 275 Orchard Rd
- 257 Orchard Rd
- 15 Crown Ct
- 31 Ivy Dr
- 27 Glorietta Ct
- 36 Oak Dr
- 142 Crestview Dr
- 121 Ardith Dr
- 78 Scenic Dr
- 0 Glorietta Blvd Unit 41113128
- 0 Parklane Dr Unit 41125580
- 230 Moraga Way
- 102 Fiesta Cir
- 40 Hilldale Ct
- 7 Whitehall Dr
- 27 Whitehall Dr
- 29 Whitehall Dr
- 10 Donna Maria Way
- 31 Ascot Place
Your Personal Tour Guide
Ask me questions while you tour the home.