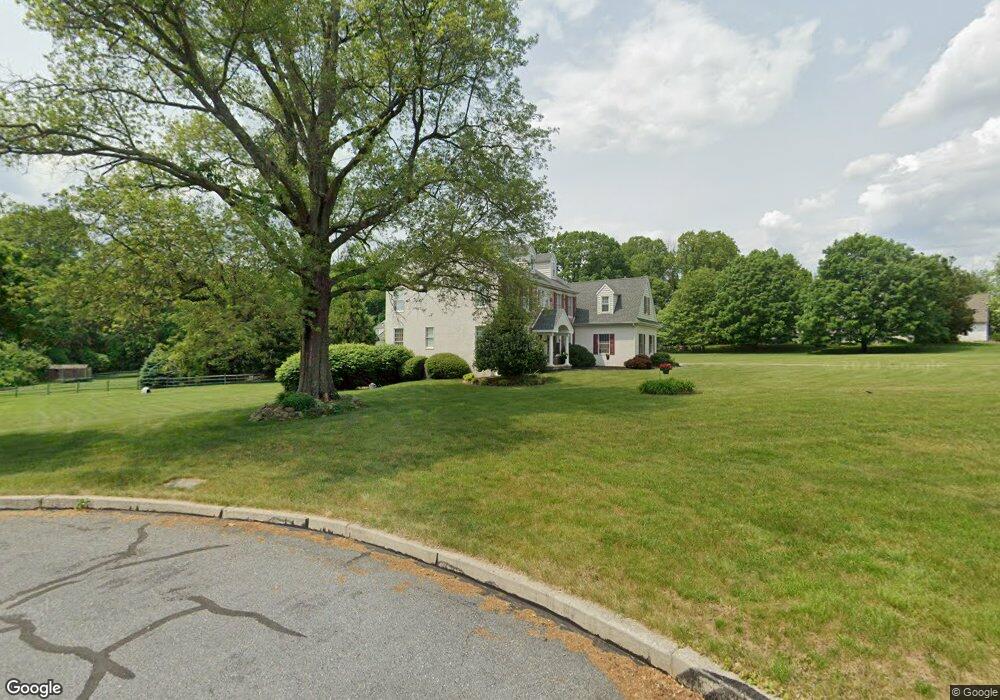
21 Red Fox Ln Glenmoore, PA 19343
West Vincent Township NeighborhoodEstimated Value: $767,000 - $941,000
4
Beds
3
Baths
3,789
Sq Ft
$223/Sq Ft
Est. Value
About This Home
This home is located at 21 Red Fox Ln, Glenmoore, PA 19343 and is currently estimated at $844,681, approximately $222 per square foot. 21 Red Fox Ln is a home located in Chester County with nearby schools including West Vincent Elementary School, Owen J Roberts Middle School, and Owen J Roberts High School.
Ownership History
Date
Name
Owned For
Owner Type
Purchase Details
Closed on
Mar 20, 2001
Sold by
Greene David G
Bought by
Greene David G and Greene Colleen A
Current Estimated Value
Purchase Details
Closed on
Mar 6, 1998
Sold by
Adams Mitchell W and Adams Lynda S
Bought by
Greene David G
Home Financials for this Owner
Home Financials are based on the most recent Mortgage that was taken out on this home.
Original Mortgage
$227,000
Interest Rate
7.04%
Purchase Details
Closed on
May 31, 1996
Sold by
Schubert Bullard Inc
Bought by
Adams Mitchell W and Adams Lynda S
Home Financials for this Owner
Home Financials are based on the most recent Mortgage that was taken out on this home.
Original Mortgage
$210,000
Interest Rate
7.91%
Purchase Details
Closed on
Nov 10, 1995
Sold by
Schubert Fred V and Schubert Maria A
Bought by
Schubert Bullard Inc
Create a Home Valuation Report for This Property
The Home Valuation Report is an in-depth analysis detailing your home's value as well as a comparison with similar homes in the area
Home Values in the Area
Average Home Value in this Area
Purchase History
| Date | Buyer | Sale Price | Title Company |
|---|---|---|---|
| Greene David G | -- | -- | |
| Greene David G | $321,000 | -- | |
| Adams Mitchell W | $325,000 | -- | |
| Schubert Bullard Inc | $1,000 | -- |
Source: Public Records
Mortgage History
| Date | Status | Borrower | Loan Amount |
|---|---|---|---|
| Previous Owner | Greene David G | $227,000 | |
| Previous Owner | Adams Mitchell W | $210,000 |
Source: Public Records
Tax History Compared to Growth
Tax History
| Year | Tax Paid | Tax Assessment Tax Assessment Total Assessment is a certain percentage of the fair market value that is determined by local assessors to be the total taxable value of land and additions on the property. | Land | Improvement |
|---|---|---|---|---|
| 2025 | $11,277 | $273,940 | $69,260 | $204,680 |
| 2024 | $11,277 | $273,940 | $69,260 | $204,680 |
| 2023 | $11,114 | $273,940 | $69,260 | $204,680 |
| 2022 | $10,934 | $273,940 | $69,260 | $204,680 |
| 2021 | $10,801 | $273,940 | $69,260 | $204,680 |
| 2020 | $10,523 | $273,940 | $69,260 | $204,680 |
| 2019 | $10,326 | $273,940 | $69,260 | $204,680 |
| 2018 | $12,197 | $329,970 | $69,260 | $260,710 |
| 2017 | $11,908 | $329,970 | $69,260 | $260,710 |
| 2016 | $10,000 | $329,970 | $69,260 | $260,710 |
| 2015 | $10,000 | $329,970 | $69,260 | $260,710 |
| 2014 | $10,000 | $329,970 | $69,260 | $260,710 |
Source: Public Records
Map
Nearby Homes
- 618 Kent Ct
- 214 Windgate Dr
- 475 Fairmont Dr Unit 237
- 955 Pinehurst Dr
- 1816 Pottstown Pike
- 684 Churchill Rd
- 570 Font Rd
- 1910 Cavalier Ln
- 38 Yarmouth Ln
- 41 Lyons Run Rd
- 3896 Coventryville Rd
- 380 Styer Rd
- 447 Greenridge Rd
- 449 Greenridge Rd
- 45 Wyndemere Lake Dr
- 2326 Conestoga Rd
- 142 Preakness Way
- 437 Mustang Rd
- 573 Trifecta Rd Unit 313
- 2290 Horseshoe Trail
- 230 Trego Rd
- 7 Red Fox Ln
- 30 Red Fox Ln
- 22 Red Fox Ln
- 26 Red Fox Ln
- 16 Red Fox Ln
- 216 Trego Rd
- 1 Red Fox Ln
- 45 Nantmeal Rd
- 245 Trego Rd
- 35 Nantmeal Rd
- 100 Nantmeal Rd Unit 3
- 100 Nantmeal Rd Unit 1
- 100 Nantmeal Rd Unit 2
- 100 Nantmeal Rd
- 100 Nantmeal Rd
- 20 Ludwigs Crossing Ln
- 22 Ludwigs Crossing Ln
- 225 Trego Rd
- 3091 Conestoga Rd