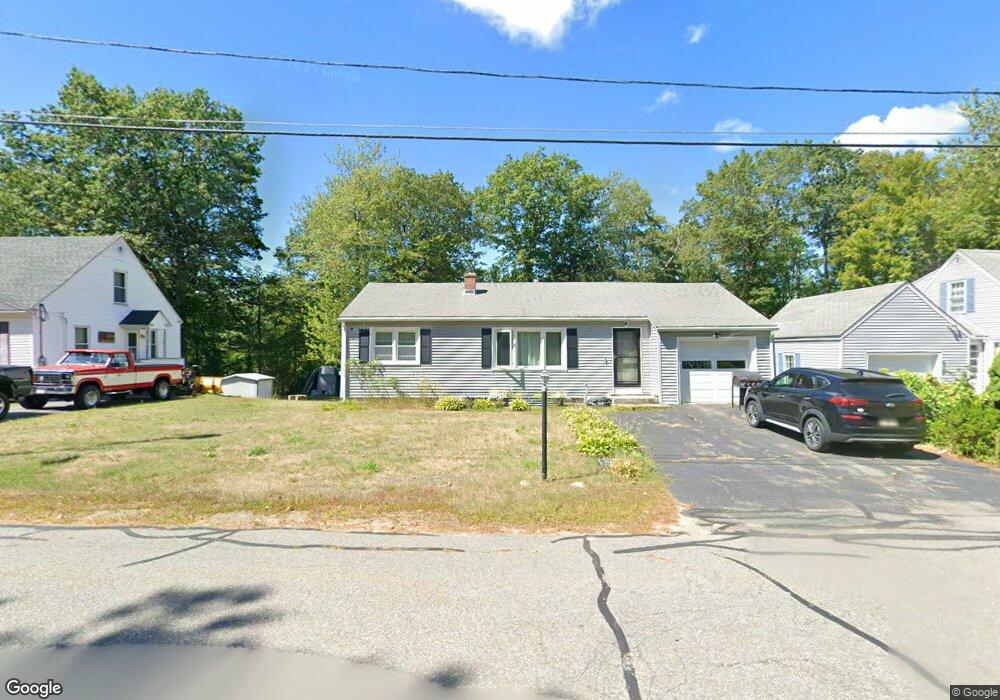
21 Ridge St Westminster, MA 01473
Estimated Value: $346,000 - $372,000
2
Beds
1
Bath
936
Sq Ft
$384/Sq Ft
Est. Value
About This Home
This home is located at 21 Ridge St, Westminster, MA 01473 and is currently estimated at $359,815, approximately $384 per square foot. 21 Ridge St is a home located in Worcester County with nearby schools including Oakmont Regional High School, Holy Family Academy, and Wachusett Hills Christian School.
Ownership History
Date
Name
Owned For
Owner Type
Purchase Details
Closed on
Oct 27, 2016
Sold by
Dyer Eileen P
Bought by
Eileen P Dyer Ret and Dyer
Current Estimated Value
Purchase Details
Closed on
Sep 25, 1998
Sold by
Napolillo Susan A
Bought by
Kelly Eileen P
Home Financials for this Owner
Home Financials are based on the most recent Mortgage that was taken out on this home.
Original Mortgage
$90,250
Interest Rate
6.87%
Mortgage Type
Purchase Money Mortgage
Purchase Details
Closed on
Sep 21, 1989
Sold by
Peltonen Dana
Bought by
Napolillo Susan
Home Financials for this Owner
Home Financials are based on the most recent Mortgage that was taken out on this home.
Original Mortgage
$82,400
Interest Rate
9.82%
Mortgage Type
Purchase Money Mortgage
Create a Home Valuation Report for This Property
The Home Valuation Report is an in-depth analysis detailing your home's value as well as a comparison with similar homes in the area
Home Values in the Area
Average Home Value in this Area
Purchase History
| Date | Buyer | Sale Price | Title Company |
|---|---|---|---|
| Eileen P Dyer Ret | -- | -- | |
| Kelly Eileen P | $95,000 | -- | |
| Napolillo Susan | $103,000 | -- |
Source: Public Records
Mortgage History
| Date | Status | Borrower | Loan Amount |
|---|---|---|---|
| Previous Owner | Napolillo Susan | $90,250 | |
| Previous Owner | Napolillo Susan | $82,400 | |
| Previous Owner | Napolillo Susan | $65,000 |
Source: Public Records
Tax History Compared to Growth
Tax History
| Year | Tax Paid | Tax Assessment Tax Assessment Total Assessment is a certain percentage of the fair market value that is determined by local assessors to be the total taxable value of land and additions on the property. | Land | Improvement |
|---|---|---|---|---|
| 2025 | $3,465 | $281,700 | $112,300 | $169,400 |
| 2024 | $3,333 | $271,900 | $112,300 | $159,600 |
| 2023 | $3,397 | $260,100 | $105,000 | $155,100 |
| 2022 | $3,305 | $209,200 | $91,300 | $117,900 |
| 2021 | $5,610 | $188,100 | $75,700 | $112,400 |
| 2020 | $3,064 | $174,600 | $68,900 | $105,700 |
| 2019 | $2,967 | $162,600 | $56,900 | $105,700 |
| 2018 | $2,799 | $150,900 | $56,900 | $94,000 |
| 2017 | $4,336 | $155,700 | $56,900 | $98,800 |
| 2016 | $2,746 | $146,200 | $47,400 | $98,800 |
| 2015 | $2,645 | $139,600 | $47,400 | $92,200 |
| 2014 | $2,650 | $139,600 | $47,400 | $92,200 |
Source: Public Records
Map
Nearby Homes