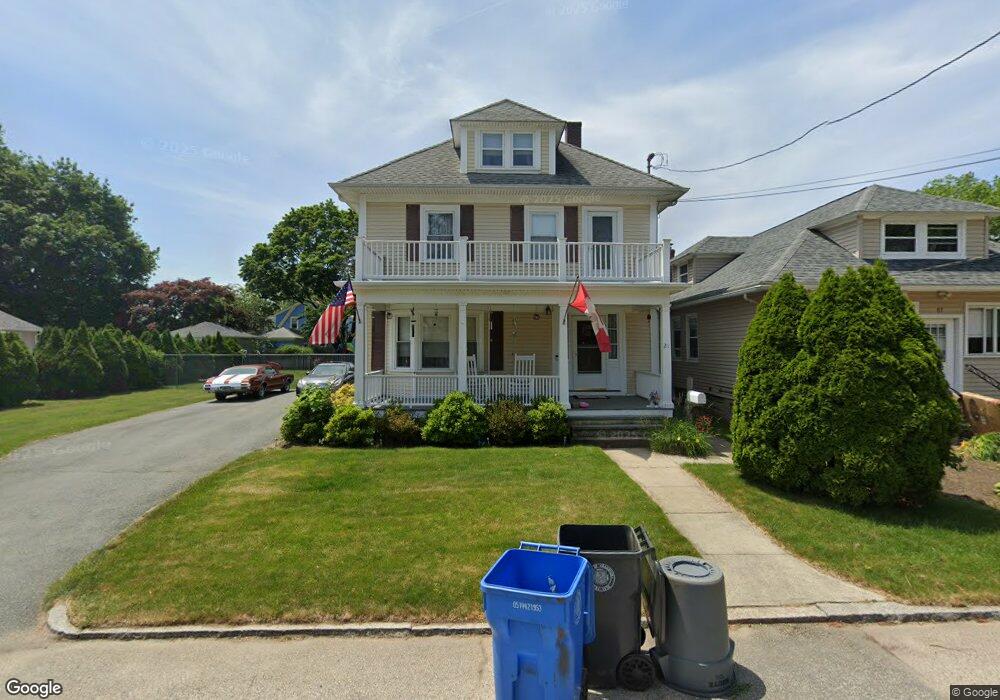
21 River St Cranston, RI 02905
Edgewood NeighborhoodEstimated Value: $394,000 - $593,000
4
Beds
1
Bath
1,872
Sq Ft
$265/Sq Ft
Est. Value
About This Home
This home is located at 21 River St, Cranston, RI 02905 and is currently estimated at $496,881, approximately $265 per square foot. 21 River St is a home located in Providence County with nearby schools including Edward S. Rhodes School, Park View Middle School, and Cranston High School East.
Ownership History
Date
Name
Owned For
Owner Type
Purchase Details
Closed on
Apr 16, 2013
Sold by
Munson Eric
Bought by
Munson Eric and Muson Johna G
Current Estimated Value
Home Financials for this Owner
Home Financials are based on the most recent Mortgage that was taken out on this home.
Original Mortgage
$144,293
Outstanding Balance
$29,672
Interest Rate
3.55%
Mortgage Type
New Conventional
Estimated Equity
$467,209
Purchase Details
Closed on
Aug 1, 1997
Sold by
Est Anderson C Sara and Anderson Ruth E
Bought by
Munson Eric and Munson Rita
Home Financials for this Owner
Home Financials are based on the most recent Mortgage that was taken out on this home.
Original Mortgage
$71,000
Interest Rate
7.55%
Create a Home Valuation Report for This Property
The Home Valuation Report is an in-depth analysis detailing your home's value as well as a comparison with similar homes in the area
Home Values in the Area
Average Home Value in this Area
Purchase History
| Date | Buyer | Sale Price | Title Company |
|---|---|---|---|
| Munson Eric | -- | -- | |
| Munson Eric | $75,000 | -- |
Source: Public Records
Mortgage History
| Date | Status | Borrower | Loan Amount |
|---|---|---|---|
| Open | Munson Eric | $144,293 | |
| Previous Owner | Munson Eric | $180,000 | |
| Previous Owner | Munson Eric | $78,000 | |
| Previous Owner | Munson Eric | $71,000 |
Source: Public Records
Tax History
| Year | Tax Paid | Tax Assessment Tax Assessment Total Assessment is a certain percentage of the fair market value that is determined by local assessors to be the total taxable value of land and additions on the property. | Land | Improvement |
|---|---|---|---|---|
| 2025 | $5,379 | $387,500 | $116,600 | $270,900 |
| 2024 | $5,274 | $387,500 | $116,600 | $270,900 |
| 2023 | $5,434 | $287,500 | $76,800 | $210,700 |
| 2022 | $5,322 | $287,500 | $76,800 | $210,700 |
| 2021 | $5,175 | $287,500 | $76,800 | $210,700 |
| 2020 | $5,012 | $241,300 | $73,200 | $168,100 |
| 2019 | $5,012 | $241,300 | $73,200 | $168,100 |
| 2018 | $4,896 | $241,300 | $73,200 | $168,100 |
| 2017 | $4,460 | $194,400 | $65,800 | $128,600 |
| 2016 | $4,364 | $194,400 | $65,800 | $128,600 |
| 2015 | $4,364 | $194,400 | $65,800 | $128,600 |
| 2014 | $4,264 | $186,700 | $65,800 | $120,900 |
Source: Public Records
Map
Nearby Homes
- 10 Sylvan Ave
- 29 Malvern Ave
- 68 Ferncrest Ave
- 27 Cliffdale Ave
- 51 Ferncrest Ave
- 153 Ferncrest Ave
- 78 Villa Ave
- 42 Netherlands Ave
- 172 Bluff Ave
- 19 Warwick Ave
- 63 Taft St
- 73 Western Promenade
- 126 Columbia Ave
- 55 Mayflower Dr
- 147 Wentworth Ave
- 1232 Narragansett Blvd
- 115 Irving Rd
- 94 Holmes Rd
- 1180 Narragansett Blvd Unit 1
- 425 Park Ave
Your Personal Tour Guide
Ask me questions while you tour the home.