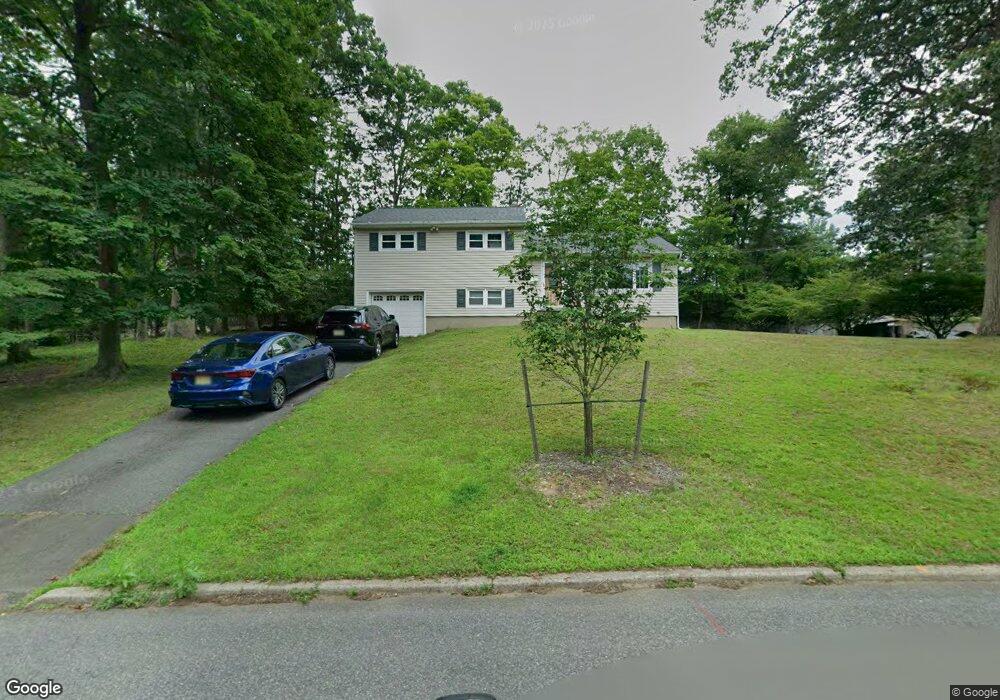
21 Roandis Ct Ramsey, NJ 07446
Estimated Value: $584,000 - $770,000
Studio
--
Bath
1,482
Sq Ft
$453/Sq Ft
Est. Value
About This Home
This home is located at 21 Roandis Ct, Ramsey, NJ 07446 and is currently estimated at $671,756, approximately $453 per square foot. 21 Roandis Ct is a home located in Bergen County with nearby schools including Ramsey High School and Young World Day School.
Ownership History
Date
Name
Owned For
Owner Type
Purchase Details
Closed on
Sep 5, 2003
Sold by
Miller Blanchard
Bought by
Lim Peter and Lim Connie
Current Estimated Value
Home Financials for this Owner
Home Financials are based on the most recent Mortgage that was taken out on this home.
Original Mortgage
$292,000
Outstanding Balance
$136,111
Interest Rate
6.31%
Estimated Equity
$535,645
Purchase Details
Closed on
Mar 30, 1999
Sold by
The Miller Family Trust and Miller Blanchard S
Bought by
Miller Blanchard S
Create a Home Valuation Report for This Property
The Home Valuation Report is an in-depth analysis detailing your home's value as well as a comparison with similar homes in the area
Home Values in the Area
Average Home Value in this Area
Purchase History
| Date | Buyer | Sale Price | Title Company |
|---|---|---|---|
| Lim Peter | $365,000 | -- | |
| Miller Blanchard S | -- | -- |
Source: Public Records
Mortgage History
| Date | Status | Borrower | Loan Amount |
|---|---|---|---|
| Open | Lim Peter | $292,000 |
Source: Public Records
Tax History
| Year | Tax Paid | Tax Assessment Tax Assessment Total Assessment is a certain percentage of the fair market value that is determined by local assessors to be the total taxable value of land and additions on the property. | Land | Improvement |
|---|---|---|---|---|
| 2025 | $11,003 | $509,700 | $295,400 | $214,300 |
| 2024 | $10,672 | $389,900 | $252,700 | $137,200 |
| 2023 | $10,227 | $389,900 | $252,700 | $137,200 |
| 2022 | $10,227 | $389,900 | $252,700 | $137,200 |
| 2021 | $10,110 | $389,900 | $252,700 | $137,200 |
| 2020 | $10,020 | $389,900 | $252,700 | $137,200 |
| 2019 | $9,584 | $389,900 | $252,700 | $137,200 |
| 2018 | $9,346 | $389,900 | $252,700 | $137,200 |
| 2017 | $9,170 | $389,900 | $252,700 | $137,200 |
| 2016 | $8,917 | $389,900 | $252,700 | $137,200 |
| 2015 | $8,997 | $333,100 | $242,700 | $90,400 |
| 2014 | $8,844 | $333,100 | $242,700 | $90,400 |
Source: Public Records
Map
Nearby Homes
- 210 Washington Dr
- 901 Washington Dr
- 121 Regency Park
- 89 Church St
- 826 Georgetown Dr
- 3 Cinnamon Dr
- 44 N Central Ave
- 121 Surrey Ct
- 193 S Franklin Turnpike
- 659 Richmond Ct
- 28 North St
- 630 Fairfax Dr
- 92 W Main St
- 175 Redwood Ct Unit 10
- 96 W Main St
- 98 W Main St
- 46 Cherry Ln
- 19 Meadowbrook Rd
- 19 Crescent Hollow Ct
- 272 Belmont Place
Your Personal Tour Guide
Ask me questions while you tour the home.