21 Rustic Ridge Rd Randolph, NJ 07869
Estimated Value: $1,165,000 - $1,283,723
Studio
--
Bath
3,878
Sq Ft
$318/Sq Ft
Est. Value
About This Home
This home is located at 21 Rustic Ridge Rd, Randolph, NJ 07869 and is currently estimated at $1,234,181, approximately $318 per square foot. 21 Rustic Ridge Rd is a home located in Morris County with nearby schools including Randolph High School, Randolph Middle School, and Apple Montessori Schools and Camps - Randolph.
Ownership History
Date
Name
Owned For
Owner Type
Purchase Details
Closed on
May 20, 2009
Sold by
Koch Kathleen M
Bought by
Rowe Anncy G and George Annakutty
Current Estimated Value
Home Financials for this Owner
Home Financials are based on the most recent Mortgage that was taken out on this home.
Original Mortgage
$622,710
Interest Rate
5.02%
Mortgage Type
FHA
Purchase Details
Closed on
Dec 1, 2004
Sold by
Koch Howard
Bought by
Koch Katheleen
Purchase Details
Closed on
Feb 10, 1997
Sold by
Rustic Woods Associates Llc
Bought by
Koch Howard H and Koch Kathleen
Create a Home Valuation Report for This Property
The Home Valuation Report is an in-depth analysis detailing your home's value as well as a comparison with similar homes in the area
Home Values in the Area
Average Home Value in this Area
Purchase History
| Date | Buyer | Sale Price | Title Company |
|---|---|---|---|
| Rowe Anncy G | $680,000 | Stewart Title Guaranty Co | |
| Koch Katheleen | -- | -- | |
| Koch Howard H | $427,587 | Chicago Title Insurance Co |
Source: Public Records
Mortgage History
| Date | Status | Borrower | Loan Amount |
|---|---|---|---|
| Previous Owner | Rowe Anncy G | $622,710 |
Source: Public Records
Tax History
| Year | Tax Paid | Tax Assessment Tax Assessment Total Assessment is a certain percentage of the fair market value that is determined by local assessors to be the total taxable value of land and additions on the property. | Land | Improvement |
|---|---|---|---|---|
| 2025 | $23,155 | $817,900 | $275,400 | $542,500 |
| 2024 | $22,574 | $817,900 | $275,400 | $542,500 |
Source: Public Records
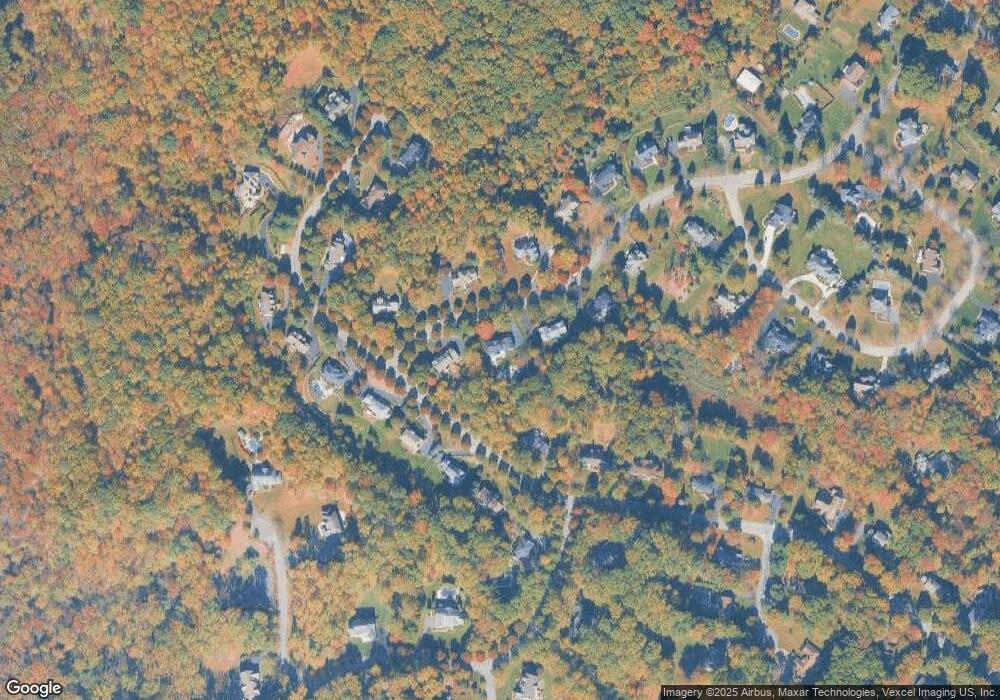
Map
Nearby Homes
- 86 Route 10
- 15 Skytop Dr
- 71 Washington Ave Unit 73
- 38 Mildred Gill Ln
- 40 Mildred Gill Ln Unit 40
- 604 Knollwood Ct Unit 604
- 77B Highland Way
- 8 Union Hill Rd
- 115 Sheffield Ct
- 188 Casterline Rd
- 44 Shongum Rd
- 107 High St
- 33 Shongum Rd
- 351 Franklin Rd
- 1104 Peer Place
- 3104 Peer Place
- 14 Jessica Ln
- 12 Glades Dr
- 30 Glattly Dr
- 8 Wadsworth Dr Unit 3
- 23 Rustic Ridge Rd
- 19 Rustic Ridge Rd
- 20 Roc Etam Rd
- 17 Rustic Ridge Rd
- 20 Rustic Ridge Rd
- 18 Rustic Ridge Rd
- 16 Roc Etam Rd
- 22 Rustic Ridge Rd
- 21 Roc Etam Rd
- 23 Roc Etam Rd
- 25 Roc Etam Rd
- 27 Roc Etam Rd
- 14 Roc Etam Rd
- 16 Rustic Ridge Rd
- 15 Rustic Ridge Rd
- 29 Roc Etam Rd
- 2 Red Oak Ln
- 36 Roc Etam Rd
- 38 Roc Etam Rd
- 14 Rustic Ridge Rd
Your Personal Tour Guide
Ask me questions while you tour the home.