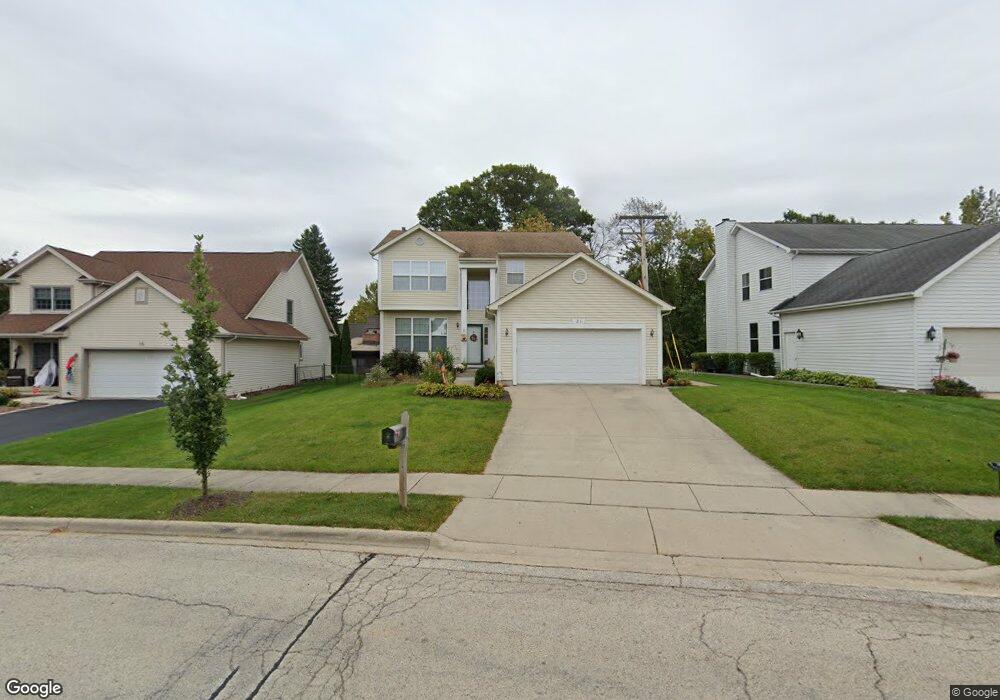
21 S Greenview Ave Mundelein, IL 60060
Estimated Value: $438,000 - $467,000
4
Beds
3
Baths
2,352
Sq Ft
$192/Sq Ft
Est. Value
About This Home
This home is located at 21 S Greenview Ave, Mundelein, IL 60060 and is currently estimated at $450,872, approximately $191 per square foot. 21 S Greenview Ave is a home located in Lake County with nearby schools including Washington Early Learning Center, Mechanics Grove Elementary School, and Carl Sandburg Middle School.
Ownership History
Date
Name
Owned For
Owner Type
Purchase Details
Closed on
Sep 16, 2025
Sold by
Belagur Vishwanath R
Bought by
Gowri Belagur Revocable Eiving Trust and Belagur
Current Estimated Value
Purchase Details
Closed on
Feb 26, 2002
Sold by
Venegas Salvador
Bought by
Belagur Vishwanath R
Home Financials for this Owner
Home Financials are based on the most recent Mortgage that was taken out on this home.
Original Mortgage
$209,000
Interest Rate
6.92%
Purchase Details
Closed on
May 14, 1999
Sold by
Thomas Dean G
Bought by
Samples George W and Samples Mary F
Home Financials for this Owner
Home Financials are based on the most recent Mortgage that was taken out on this home.
Original Mortgage
$42,000
Interest Rate
6.99%
Purchase Details
Closed on
Mar 31, 1998
Sold by
Thomas Mariquita
Bought by
Thomas Dean G
Create a Home Valuation Report for This Property
The Home Valuation Report is an in-depth analysis detailing your home's value as well as a comparison with similar homes in the area
Home Values in the Area
Average Home Value in this Area
Purchase History
| Date | Buyer | Sale Price | Title Company |
|---|---|---|---|
| Gowri Belagur Revocable Eiving Trust | -- | None Listed On Document | |
| Belagur Vishwanath R | $262,000 | Imperial Land Title Inc | |
| Samples George W | $55,000 | -- | |
| Thomas Dean G | -- | Chicago Title Insurance Co |
Source: Public Records
Mortgage History
| Date | Status | Borrower | Loan Amount |
|---|---|---|---|
| Previous Owner | Belagur Vishwanath R | $209,000 | |
| Previous Owner | Samples George W | $42,000 |
Source: Public Records
Tax History Compared to Growth
Tax History
| Year | Tax Paid | Tax Assessment Tax Assessment Total Assessment is a certain percentage of the fair market value that is determined by local assessors to be the total taxable value of land and additions on the property. | Land | Improvement |
|---|---|---|---|---|
| 2024 | $11,099 | $132,619 | $17,626 | $114,993 |
| 2023 | $10,321 | $112,513 | $14,954 | $97,559 |
| 2022 | $10,321 | $101,939 | $17,912 | $84,027 |
| 2021 | $9,873 | $98,369 | $17,285 | $81,084 |
| 2020 | $9,714 | $95,661 | $16,809 | $78,852 |
| 2019 | $9,403 | $92,515 | $16,256 | $76,259 |
| 2018 | $5,267 | $97,114 | $16,896 | $80,218 |
| 2017 | $9,789 | $94,057 | $16,364 | $77,693 |
| 2016 | $9,540 | $89,332 | $15,542 | $73,790 |
| 2015 | $9,308 | $83,746 | $14,570 | $69,176 |
| 2014 | $8,806 | $80,912 | $14,017 | $66,895 |
| 2012 | $9,330 | $81,630 | $14,141 | $67,489 |
Source: Public Records
Map
Nearby Homes
- 116 S Pershing Ave
- 29746 U S 45
- 207 N Idlewild Ave
- 250 N Fairlawn Ave
- 331 Plaza Cir
- 26980 N Pierre Dr
- 1297 Spalding Dr
- 1305 Spalding Dr
- 26220 N Midlothian Rd
- 547 N Ridgemoor Ave
- 619 N California Ave Unit 1
- 201 Bingham Cir
- 26892 N Iride Dr
- 19925 W Il Route 60
- 851 Glenview Ave
- 208 Bingham Cir
- 742 N Lake St
- 19738 W Martin Dr
- 728 W Maple Ave
- 1360 Edington Ln
- 27 S Greenview Ave
- 15 S Greenview Ave
- 321 W Courtland St
- 33 S Greenview Ave
- 409 W Courtland St
- 313 W Courtland St
- 39 S Greenview Ave
- 28 S Prairie Ave
- 33 N Greenview Ave
- 22 S Prairie Ave
- 28 S Greenview Ave
- 415 W Courtland St
- 34 S Prairie Ave
- 39 N Greenview Ave
- 45 S Greenview Ave
- 2223 Glacier St
- 2225 Glacier St
- 2219 Glacier St
- 34 N Prairie Ave
- 34 S Greenview Ave