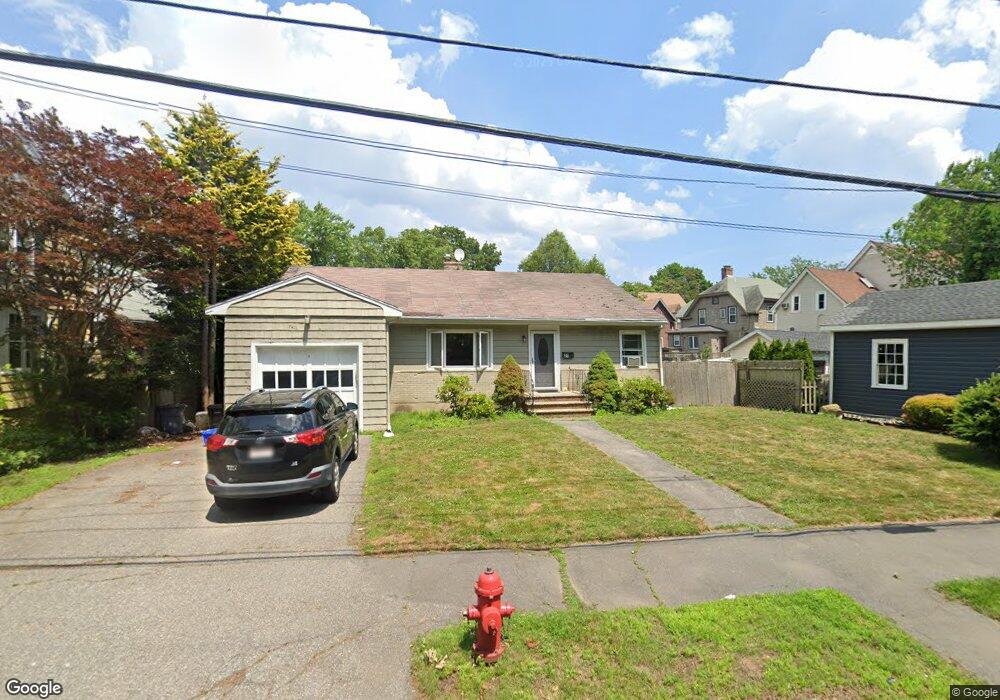
21 Salem St Swampscott, MA 01907
Estimated Value: $845,000 - $1,077,000
4
Beds
2
Baths
2,782
Sq Ft
$341/Sq Ft
Est. Value
About This Home
This home is located at 21 Salem St, Swampscott, MA 01907 and is currently estimated at $947,464, approximately $340 per square foot. 21 Salem St is a home located in Essex County with nearby schools including Swampscott Middle School, Swampscott High School, and Epstein Hillel School.
Ownership History
Date
Name
Owned For
Owner Type
Purchase Details
Closed on
Oct 14, 2003
Sold by
Minton-Halloran Geraldine and Smith Peter L
Bought by
Gordon Jonathan
Current Estimated Value
Home Financials for this Owner
Home Financials are based on the most recent Mortgage that was taken out on this home.
Original Mortgage
$284,000
Outstanding Balance
$133,803
Interest Rate
6.35%
Mortgage Type
Purchase Money Mortgage
Estimated Equity
$813,661
Create a Home Valuation Report for This Property
The Home Valuation Report is an in-depth analysis detailing your home's value as well as a comparison with similar homes in the area
Home Values in the Area
Average Home Value in this Area
Purchase History
| Date | Buyer | Sale Price | Title Company |
|---|---|---|---|
| Gordon Jonathan | $355,000 | -- | |
| Gordon Jonathan | $355,000 | -- |
Source: Public Records
Mortgage History
| Date | Status | Borrower | Loan Amount |
|---|---|---|---|
| Open | Gordon Jonathan | $284,000 | |
| Closed | Gordon Jonathan | $284,000 |
Source: Public Records
Tax History Compared to Growth
Tax History
| Year | Tax Paid | Tax Assessment Tax Assessment Total Assessment is a certain percentage of the fair market value that is determined by local assessors to be the total taxable value of land and additions on the property. | Land | Improvement |
|---|---|---|---|---|
| 2025 | $7,535 | $656,900 | $316,400 | $340,500 |
| 2024 | $7,356 | $640,200 | $302,200 | $338,000 |
| 2023 | $7,033 | $599,100 | $273,900 | $325,200 |
| 2022 | $6,479 | $505,000 | $236,100 | $268,900 |
| 2021 | $6,383 | $462,500 | $217,200 | $245,300 |
| 2020 | $6,140 | $429,400 | $188,900 | $240,500 |
| 2019 | $5,711 | $375,700 | $151,100 | $224,600 |
| 2018 | $5,709 | $356,800 | $132,200 | $224,600 |
| 2017 | $5,957 | $341,400 | $132,200 | $209,200 |
| 2016 | $5,754 | $332,000 | $122,800 | $209,200 |
| 2015 | $5,613 | $327,300 | $118,100 | $209,200 |
| 2014 | $5,225 | $279,400 | $99,200 | $180,200 |
Source: Public Records
Map
Nearby Homes
- 24 Orchard Cir
- 37 Stanley Rd
- 25 Manton Rd
- 71 Walnut Rd
- 1004 Paradise Rd Unit PHJ
- 1006 Paradise Rd Unit 3R
- 48 Bellevue Rd
- 309 Paradise Rd
- 9 Tedesco Pond Place Unit 9
- 35 Alden Rd
- 306 Paradise Rd
- 8 Ocean View Rd
- 2 Wilfred Terrace
- 6 Loring Hills Ave Unit D3
- 75 Bay View Dr
- 445 Essex St Unit 304
- 21 Bay View Dr
- 10-12 Fairview Ave
- 212 Humphrey St Unit 205
- 8 Ryan Place
- 21 Salem St Unit 1
- 20 Salem St Unit 1
- 20 One Salem St Unit 20
- 15 Salem St Unit 1
- 15 One Salem St Unit 15
- 16 Salem St Unit 1
- 39 Salem St Unit 1
- 39 Salem St
- 17 Salem St Unit 1
- 40 Salem St Unit 1
- 14 Salem St Unit 1
- 38 Salem St Unit 1
- 1 Salem St
- 1 Salem St Unit 13B
- 1 Salem St Unit 29
- 1 Salem St Unit 1
- 1 Salem St Unit 39
- 1 Salem St Unit 30
- 1 Salem St Unit 29
- 1 Salem St Unit 6